The
OPERA Target Tracker
Technical Design Report
1 Target Tracker
1.1 Introduction
The main role of the Target Tracker is to locate the lead/emulsion
brick where a neutrino interaction occurred. It will also provide
a neutrino interaction trigger for the readout of the whole
detector and be used as a calorimeter for the event analysis.
The required high brick finding efficiency puts strong
requirements on the Target Tracker spatial resolution. Taking also
into account the fact that the replacement of faulty elements of
the Target Tracker is extremely difficult, this detector must
present a long term stability and reliability. In case of problems
on a portion of the tracker, the brick finding efficiency not only
of the bricks just in front of this dead surface but on several
walls upstream will severely be affected. The surface to be
covered being of the order of 3000 m2, a cost effective
technology had to be chosen.
The electronic detectors chosen to be placed in the target section
of the OPERA detector are scintillator strips, 6.86 m length,
10.6 mm thick, 26.3 mm wide, read using Wave Length Shifting (WLS)
fibres and photodetectors placed at both ends of the
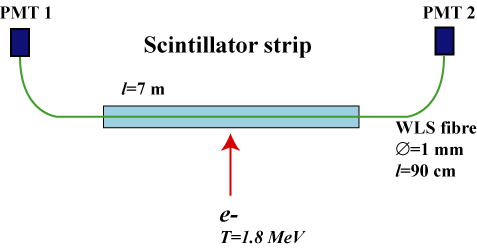
fibers [1]. The particle detection principle is depicted
by Fig. 1 The scintillator strips are obtained by
extrusion, with a TiO2 co-extruded reflective coating for
better light collection. A 6.86 m long groove, 2.0 mm deep, 1.6 mm
wide, in the centre of the scintillator strip, houses the WLS
fibre which is glued in the groove using a high transparency glue.
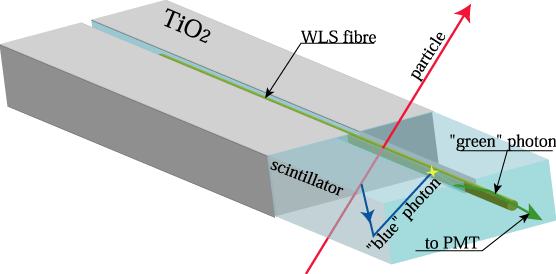 Figure 1: Particle detection principle.
The chosen detector is very reliable due to the robustness of the
elements used (plastic scintillator strips, optical fibres,
PMT's). Delicate elements, like electronics and PMT's are placed
in accessible places.
1.2 Description
A basic unit of the target tracker is constituted by 64 strips
readout by WLS fibres coupled to two 64-pixel photodetectors.
Four such modules will be assembled in situ to construct a whole
scintillator plane in order to cover the 6.7×6.7 m2
sensitive surface defined by the target bricks. One plane of 4
modules of horizontal strips and one plane of 4 modules of
vertical ones form a scintillator wall providing an x-y track
information (Fig. 2). This assembly system has
the advantage to allow the parallel production of several modules
and minimize the mounting time in the underground Gran Sasso
laboratory. The quantities of the various detector components are
reported in Table 1.
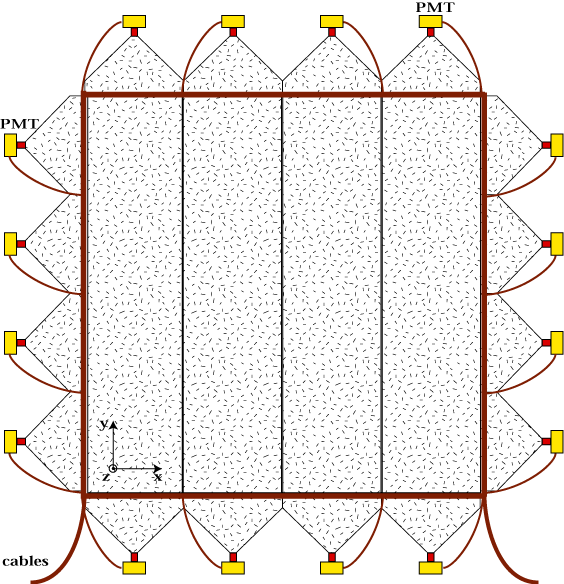 Figure 2: Schematic view of a plastic scintillator strip
wall.
 Figure 3: Schematic view of a Target Tracker scintillator
strip module.
Table 1: Summary of the main numbers for the Target
Tracker.
|
| Number of detector components | per plane | per wall | for the full detector |
|
| Scintillator modules | 4 | 8 | 496 |
| Scintillator planes | 1 | 2 | 124 |
| Scintillator strips | 256 | 512 | 31744 |
| PMT's | 8 | 16 | 992 |
|
By gluing the 64 strips of the module together, the mechanical
strength is given by the strips themselves and the aluminium
sheets enveloping them. Fig. 3 presents a
schematic view of a Target Tracker module.
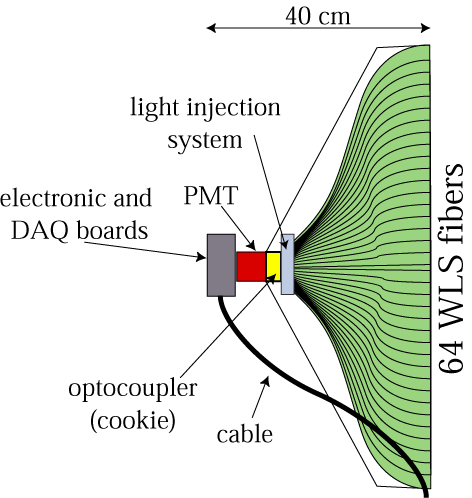
The fibres are directly routed at both ends to the photodetectors
through the end-caps (Fig. 4). The total
end-cap's length is imposed by the minimum fibre bending radius
which is of the order of 6 cm, the photodetector and cookie length
(about 7 cm), the electronic readout cards (5 cm) and a rigid part
less than 10 cm length necessary to support the other modules in
the same plane. Thus, the total length does not exceed 40 cm,
maximum length imposed by the brick manipulator machine.
The end-caps have a thickness of about 14 mm near the
scintillator strips and about 32 mm at the level of the
photodetectors imposed by the Hamamatsu multianode PMT thickness
(30 mm leaving 1 mm margin on each side). The low voltage and
readout cables can be extracted and routed through a narrow column
behind the end-caps (see section 1.3.3).
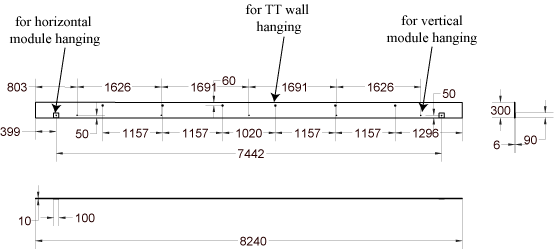
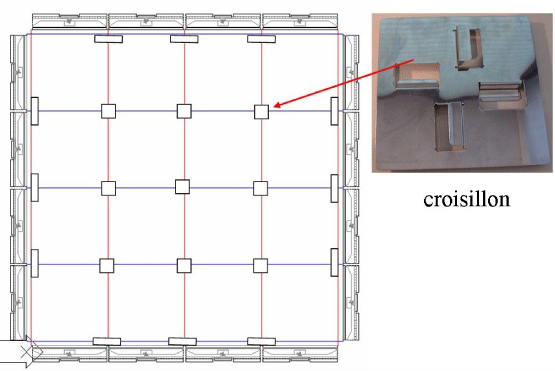
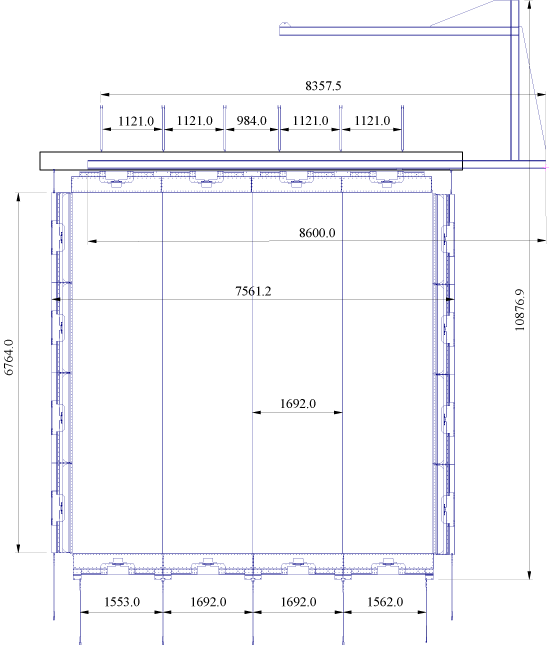
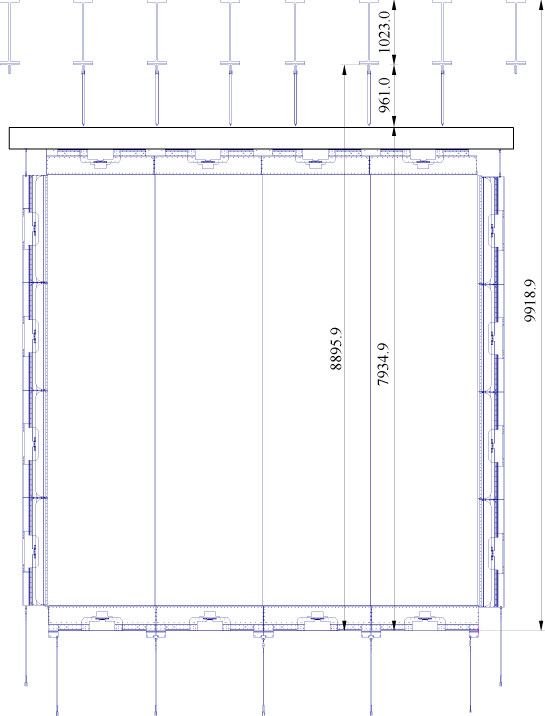
Target Tracker walls hanging in between two brick walls are shown
schematically by Fig. 5, the walls are suspended on
the OPERA main I-beams independently of the brick walls. The
vertical modules are directly suspended on the OPERA main I-beams
while the horizontal modules are suspended on one another (see
1.9). The advantage of this method is that the
target tracker construction is independent of the brick wall
construction and any brick wall displacement during brick
mounting. In this case the end-caps of the horizontal modules
must be rigid enough to support the other modules.
The total minimum wall thickness in the sensitive area covered by
the emulsion bricks is 28.8 mm (strip thickness=10.6 mm, aluminium
sheets=0.6 mm, double face adhesive =0.9 mm per plane and 1 mm
space between the two planes). At least 1 mm tolerance must be
added on each side of a plane increasing the total wall thickness
of the sensitive area to about 31 mm. Fig. 6
summarizes the main module dimensions.
The dead space induced by the space between modules, the
mechanical tolerance between stirps of 0.1 mm and the scintillator
strip TiO2 wrapping (0.15 mm thick) is of the order of 1.5% of
the overall sensitive surface.
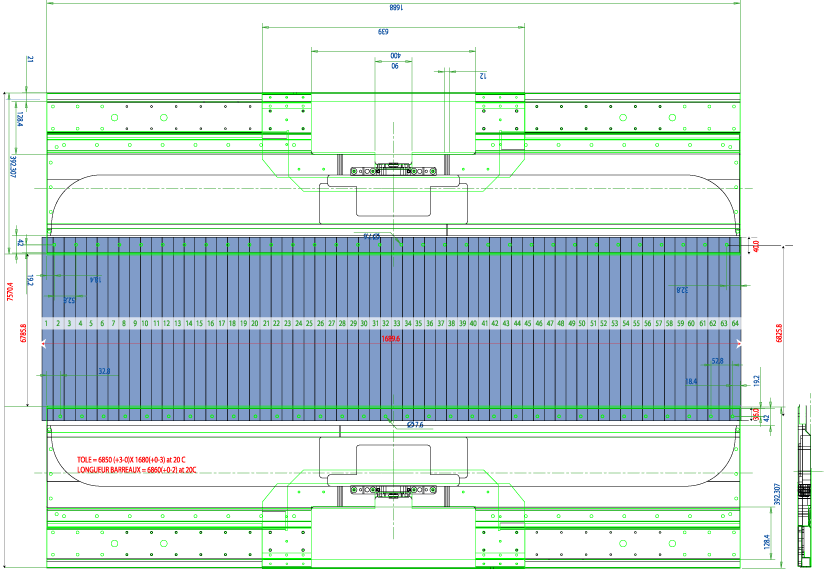 Figure 6: Main dimensions of the Target Tracker modules.
1.3 Components
A description of the main components entering the Target Tracker
construction is given in this section.
1.3.1 Plastic Scintillator Strips
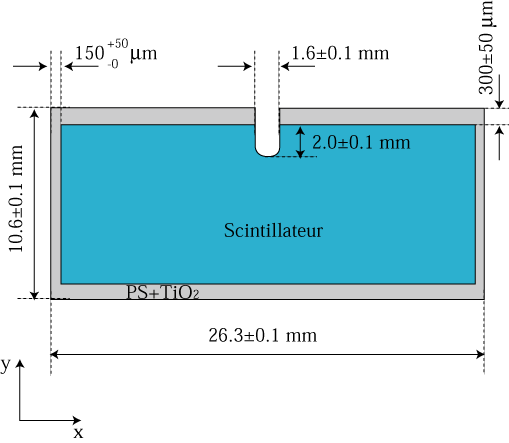
The geometry of the plastic scintillator strips is shown in
Fig. 7. The plastic scintillator is made of
polystyrene, 2% p-Terphenyl (primary fluor) and 0.02% POPOP
(secondary fluor). Fig. 8 presents the absorption and
emission spectra of the fluors. The plastic scintillator strips
will be produced by AMCRYS-H company1.
Figure 7: Scintillator strip geometry (left,
right).
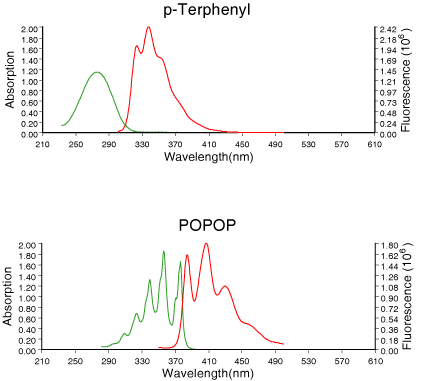 Figure 8: Absorption and emission spectra of
the fluors.
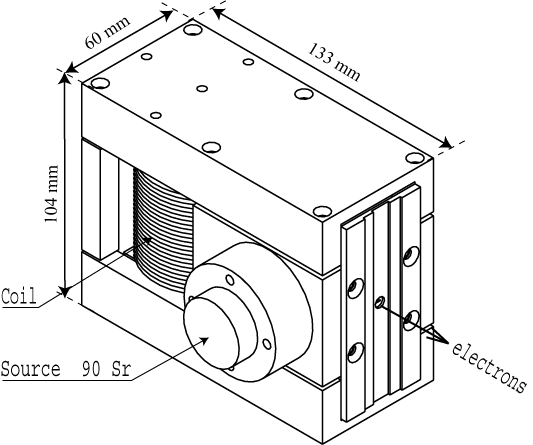
Several plastic scintillator strips produced by different
companies have been tested using the setup shown by
Fig. 9. The tests have been done by irradiating the
scintillator strips by electrons of 1.8 MeV selected from a
90Sr b source with the help of a well calibrated
electron magnetic spectrometer (Fig. 10). An electron
trigger at the exit of the spectrometer is provided by a
100 mm thick scintillator slide which is read on its two
opposite sides by two PMT's in coincidence. The signal readout was
done by two Hamamatsu bialkali PMT's H3164-10 through a WLS fibre
glued in a groove, 2.0 mm depth, performed at the scintillator
surface.
Fig. 11 presents the number of photoelectrons (p.e)
versus the distance from the two PMT's for several samples
provided by AMCRYS-H company. In the worst case where the particle
crosses the strip at its middle (4.5 m distance from each PMT),
the number of observed p.e is well above 4 inducing a particle
detection efficiency higher than 98%.
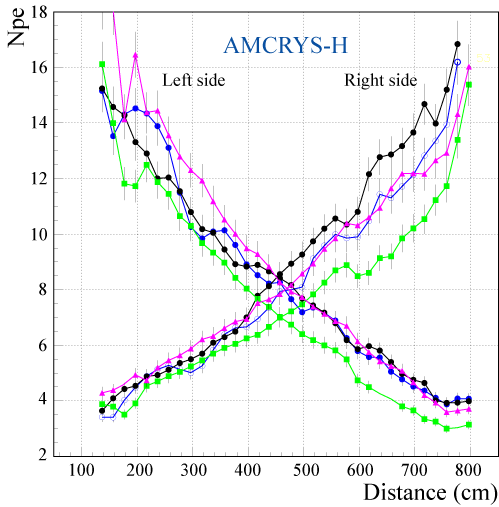 Figure 11: Number of photoelectrons versus the distance from
the PMT's for AMCRYS-H strip samples. For this measurement,
Kuraray Y11 (175) fibres have been used.
Test of scintillator strips and glued WLS fibres:
An electron spectrometer has been used to study the light yield of
full length scintillator strips equipped with WLS fibres and
estimate the track detection efficiency over the detector surface.
Primary photons produced in the strip by an ionizing particle can
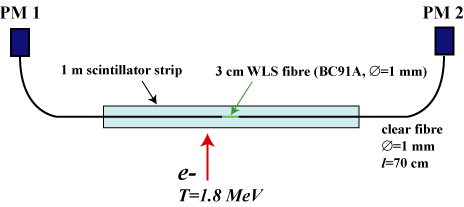
make several reflections on the strip surface before entering the
WLS fibre. To evaluate the distribution of the distance between
the production position and the entry point in the fibre, the
setup shown schematically by Fig. 12 has
been used. In a scintillator strip, a 3 cm WLS fibre has been
glued at both ends to two clear fibres. The scintillator strip has
been irradiated by the electron spectrometer at several positions
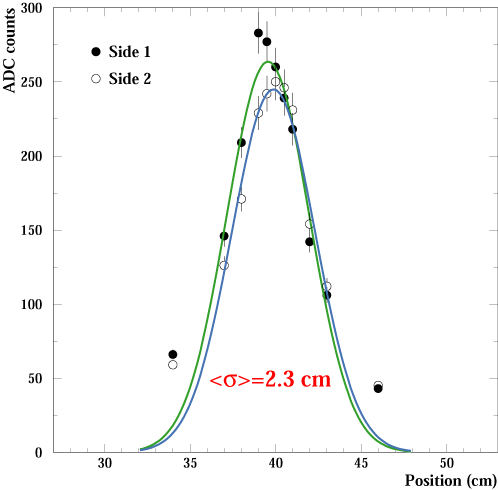
w.r.t. the WLS fibre position. Fig. 13
presents the amount of light collected at both clear fibre ends. A
gaussian distribution has been fitted on the data with an r.m.s.
of 2.3 cm. Taking into account the WLS fibre length, the r.m.s. of
the light expansion distribution has been calculated to be about
2.2 cm.
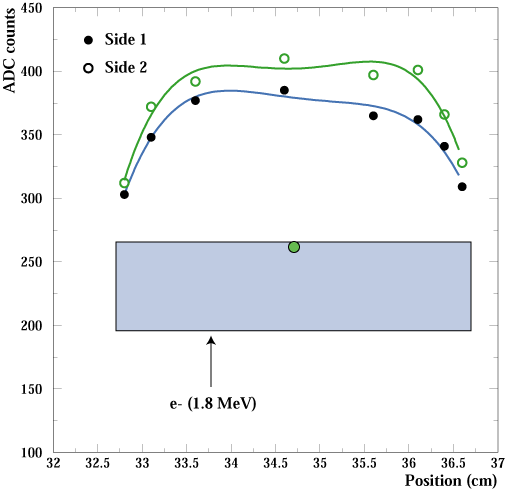
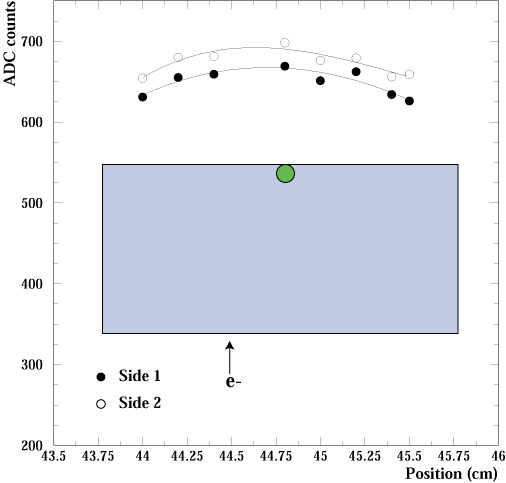
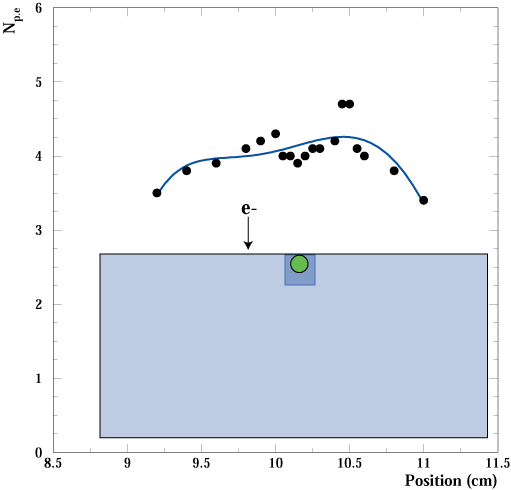
To study the light collection across a scintillator strip width
and mainly near the strip edges and the fibre position, strips has
been scanned with the electron spectrometer.
Fig. 14 presents the measurement using a 4 cm wide
strip while Fig. 15 and 16 show
the results using a 2.0 cm and 2.6 cm (close to the final
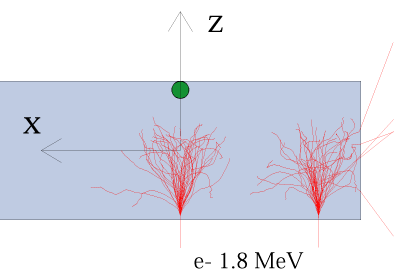
geometry) wide strips. Near the edge of the strip a loss of light
is observed due to escaping electrons as shown by the GEANT
simulation of Fig. 17. This, of course, will not happen
for minimum ionizing particles.
Electrons with an energy around 2.15 MeV can mimic the energy loss
of minimum ionizing particles (MIP). At 2.15 MeV the trigger rate
provided by the electron spectrometer equiped with a 10 mCi
90Sr source is prohibitive. For this reason, the electron
spectrometer was always operated at an electron energy of 1.8 MeV
where the trigger rate is of the order of 100 Hz. In this
condition, a correction factor of 2.15/1.8 ~ 1.19 was always
applied on the measured number of p.e. Tests with a pion beam at
PS (CERN) have been done in order to verify the above assumption.
The ratio between the measurements done with the PS beam and those
done with the electron spectrometer has been found to be 1.15
compatible with the previous 1.19 correction factor.
Fig. 18 presents the light collection at both ends
of a 2 m scintillator strip equipped with a WLS 1.0 mm fibre
versus the beam angle. A very clear cosqbeam dependence
as expected is observed.
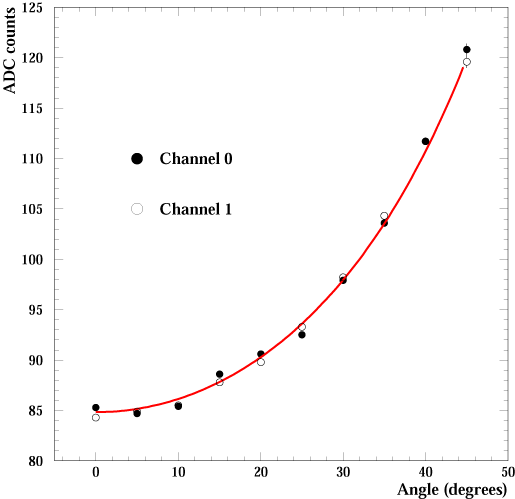 Figure 18: Light (in ADC counts) versus the beam angle w.r.t.
the normal incidence on the scintillator strip (the fitted curve
is proportional to cosqbeam).
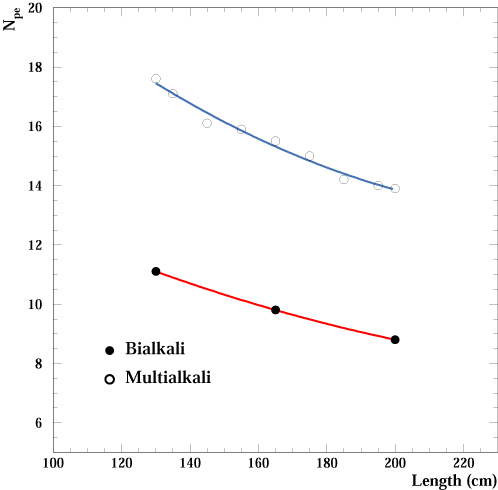
Another test done was the comparison between a bialkali and a
multialkali photocathode using the scintillator test setup. For
this comparison, the two Hamamatsu PMT's H3164-10 (bialkali) and
R7400U-02 (multialkali) have been used. With a multialkali
photocathode a factor of 1.6 more light is collected compared to
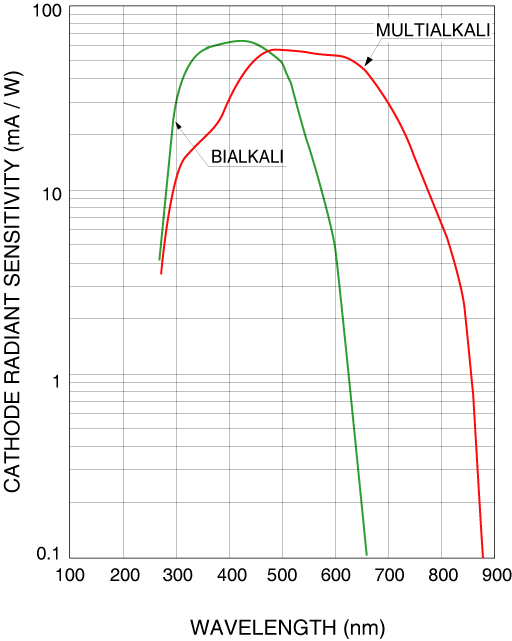
the bialkali one (Fig. 19). This number
doesn't strongly depend on the distance (over 2 m) and can be
explained by the different Quantum Efficiency spectra
(Fig. 20) around 510 nm, the mean detected photon
wavelength. Despite this advantage of multialkali PMT's, these
phototubes have a very high dark current and cannot be used by
OPERA for which the trigger is based on the photodetectors signal.
1.3.2 Wavelength Shifting Fibres
A very important parameter of WLS fibres is their attenuation
length. Several double clad fibres commercially available from
Bicron2, Kuraray3 and Pol.Hi.Tech4 have been
tested.
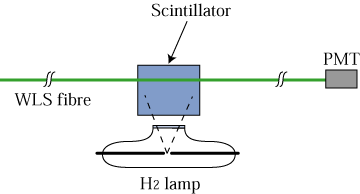 Figure 21: Setup for WLS fibre attenuation study.
The setup used to measure the attenuation in the fibres versus the
distance is shown by Fig. 21. A H2 U.V. lamp has
been used to excite a NE1105
scintillator in which a 1 mm diameter hole has been machined. The
light emitted by the scintillator is collected by the WLS fibre,
as it will be the case in the experiment. The distance between the
PMT (Hamamatsu bialkali H3164-10) and the illumination point is
variable (up to 10 m).
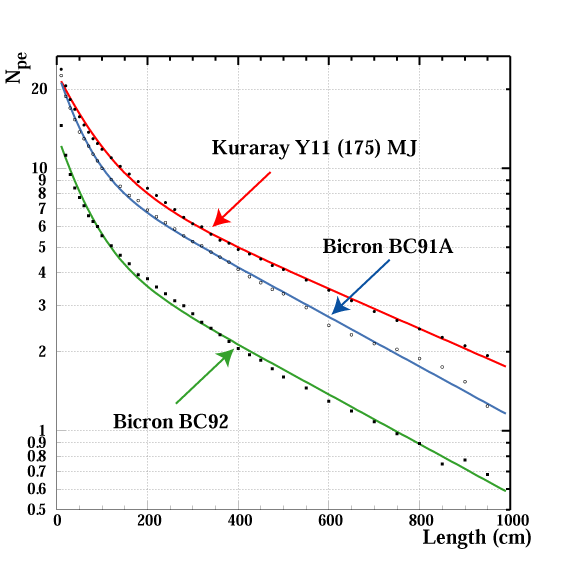
Fig. 22 shows the collected light intensity versus
the distance for 3 different 1 mm diameter WLS fibres. The
equivalent number of p.e given in y-axis is obtained by
normalization after a measurement done with a scintillator strip
and BC91A fibre as described in subsection 1.3.1 and
it is given just for indication. The fitted curves are the sum of
2 exponential distributions:
eas-x/ls+eal-x/ll. The fitted values of
the parameters are given in table 2. As one
can see, the Kuraray Y11 (175) WLS fibre gives the best results.
The two Bicron fibres have the same absorption length but the
light yield is significantly different.
Table 2: Fitted parameters of the WLS fibres. The fitted
distribution was:
eas-x/ls+eal-x/ll.
|
| Fibre type | as | ls (cm) | al | ll (cm) |
|
| Kur. Y11 (175) | 2.59 | 79.0 | 2.29 | 573.2 |
| BC91A | 2.62 | 52.2 | 2.30 | 460.0 |
| BC92 | 2.14 | 58.2 | 1.62 | 460.1 |
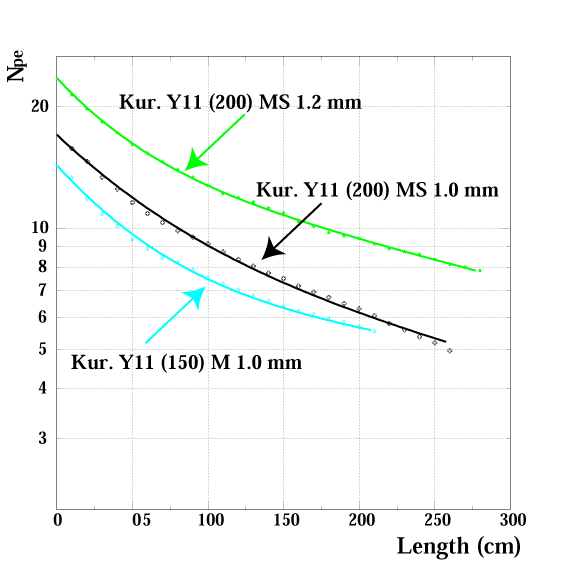
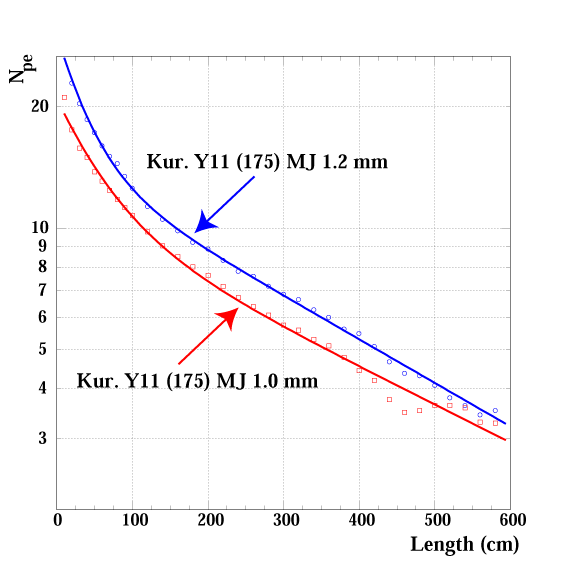
Fig. 23 shows a comparison between several
Kuraray fibres, while Fig. 24 compares two Kuraray
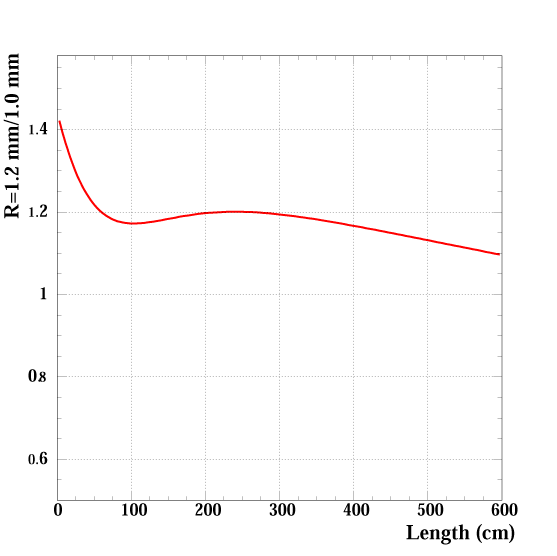
fibres of 1.0 mm and 1.2 mm diameter. The ratio of these last two
measurements is given by Fig. 25 and depends on
the distance. At a 0 distance this ratio is about 1.4 and goes
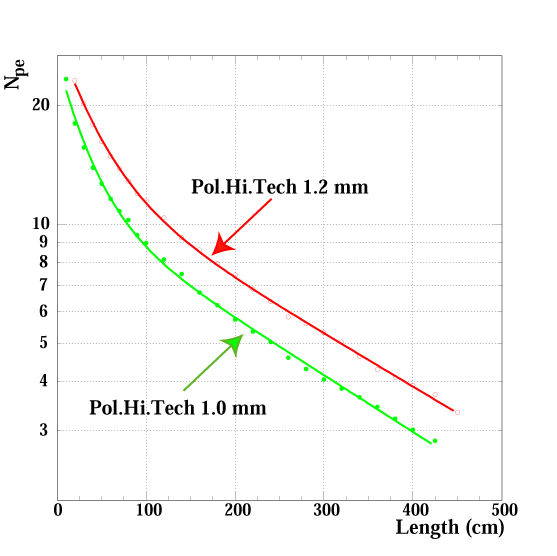
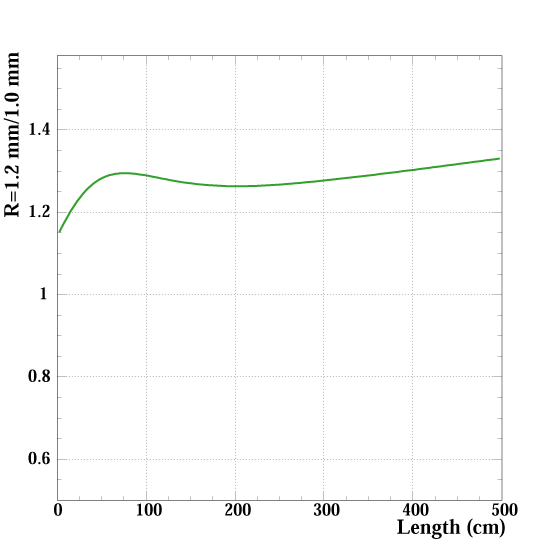
down to 1.1 at 6 m. Fig. 26 and
27 show the same comparison but for Pol.Hi.Tech
fibres. Finally, Kuraray 1 mm Y11 (175)MJ non-S fibre has been
chosen for the Target Tracker. Of course, 1.2 mm fibre would give
significantly more light, but it would increase the fibre cost by
a factor of 1.4.
The glue chosen to keep the WLS fibres in the strip grooves is the
EPON SHELL 815C with TETA hardener (13%). Both components have
been extensively tested and have also been used by MINOS
experiment[2].
The two end-caps of each target tracker module play an important
role. They protect the WLS fibres emerging from the scintillating
strips that are guided towards the input window of the multi-anode
photomultipliers. They host the PM tubes as well as the
monitoring light injection system, the front-end electronic cards
and the HV power supplies. They also provide the mechanical
structure by which the modules will be suspended on the OPERA
detector.
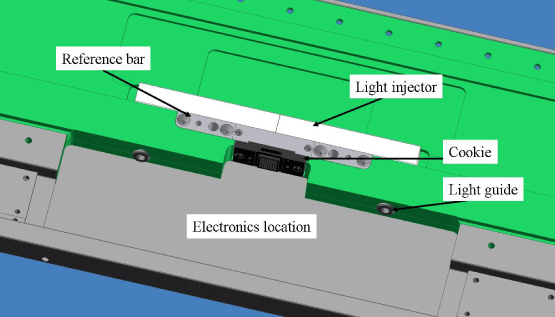 Figure 28: 3D view of the central part of an end-cap.
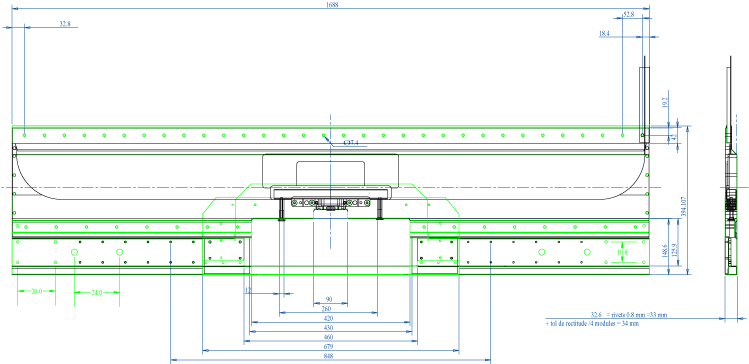 Figure 29: Technical drawing of an end-cap.
Technical specification of the end-caps:
An end-cap is a roughly rectangular object of approximately
1.7×0.4 m2 area. It has a thickness of 3.4 cm and
weights about 10 kg. It is made of a body and two soft steel
covers, a main and a small. The core of the body is a block of
320 kg/m3 polyurethane foam that is glued on a soft steel
frame. Soft steel has been chosen for the sake of magnetic
shielding. The outside of the frame is black mat anodized to cope
with the optical requirements of the brick manipulator robot.
A housing for the free ends of the optical fibres is machined into
the body. The housing and the facing section of the cover are
lined with soft tissue to protect the fragile thin fibre cladding
from scratches.
Half of the strips, one every other, are attached to one end-cap,
and so for the other half. For that purpose, the end-caps are
equipped with 32 alignment rivets of 7.3 mm diameter spaced by
52.8 mm, twice the maximal scintillator strip width plus 0.1 mm
tolerance between strips.
At the centre of the opposite side of an end-cap, the fibre
housing is closed by a piece of black plastic, named "cookie" in
this document, (Fig. 28, see also subsection
1.3.4).
Two reference holes are drilled through the body of the end-caps.
They will serve for their absolute positioning on the module
assembly table. The frame also provides an external housing for
the MAPMT, its power supply, the front-end electronics and the
cables. When closed with its main cover, it guarantees the light
tightness in the fibre housing. The small cover is meant to be a
mechanical protection for the electronics housing after module
assembly.
Vertical modules will be suspended by their top end-caps. The two
end-caps of the upper module in a horizontal plane will support
the weight of the full plane, i.e. about 800 kg.
All end-caps are constructed by Aériane
company6.
Drawings:
Fig. 28 shows a 3D artistic view of the central part
of an end-cap while Fig. 29 presents a mechanical
drawing.
A high precision reference bar is machined with threaded holes to
mount the PMT input window (cookie) in front of the optical
window. This bar also mechanically reinforces the region around
the cookie. Fig. 30 presents the drawing of this
reference bar supporting the cookie.

Figure 30: Drawing of reference bar supporting the cookie
inside the end-caps.
Parts, material:
Table 3 lists the main specifications of the
materials used and the types of ironmongery, glue and other small
hardware needed for the construction of the end-caps.
Table 3: end-caps items specifications.
|
| Item | Specifications |
|
| Frame, covers | Soft steel ST37 with relative
magnetic
permittivity 200 |
| Outer faces are black mat anodised |
| Foam | Polyurethane quality ECOPUF 320 kg m-3 |
| Tissue | Neoprene foam EVA 2mm by GRANDO |
| Rivets | Beluma M5 type AVK MS-ALS4-580-5.7 Crimping tool AKPT15P580 |
| Screws | Hexagon socket button head cap screws with
flange, steel zinc plated type ELZN ISO898 |
| Glue for optical window | Two-component molding Araldite: Araldite D / hardener HY 951 |
| Glue for frame | Two-component Epoxy: resin SR 1500 / hardener SD 2503 |
| mixed with 40% silica micro-balls type Aerosil |
| Cookies | Black Ertalon 6SA |
| Reference bar | Soft steel E24 |
|
1.3.4 Optical Coupling
The optical coupling between the WLS fibres and the photodetector
window will be done by a plastic intermediate piece called
"cookie". Fig. 31 presents the drawing of the
cookies.
The cookie is aimed at precisely positioning each fibre in front
of its PMT channel. It is drilled with 64 holes of diameter
1.08 mm to receive the free ends of the fibres during module
assembly. It is equipped with a pocket that will be potted with
molding Araldite glue to form the optical window after machining.
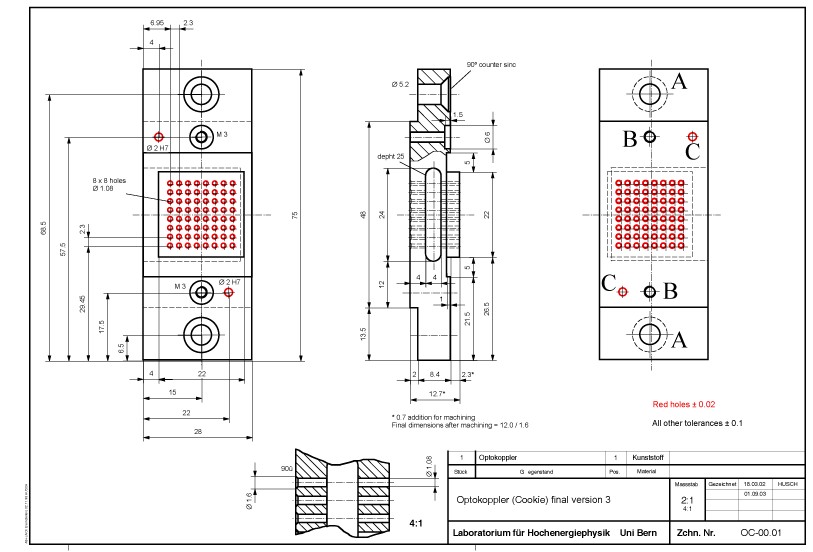 Figure 31:
Optical coupling piece (cookie).
Three couple of holes, apart of the 8×8 holes for the WLS
fibres, are present on the cookies. The holes A
(Fig. 31) are used to fix the cookies on the
end-caps. Holes B and C are used to fix and precisely align
(resp.) the cookies with the PMT's.
1.3.5 Photodetectors
The choice of the photodetector is mainly based on the single photoelectron
detection efficiency, the dynamic range, the cost and the geometry. Other
considerations are gain uniformity among channels, linearity and cross talk.
The photodetector chosen for the OPERA Target Tracker is the commercially
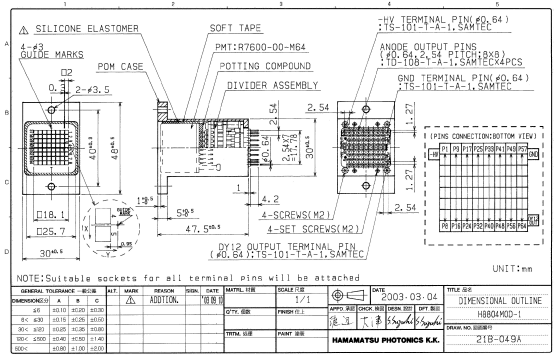
available 64-channel Hamamatsu H7546 PMT (Fig. 32). These PMT's are
powered by a negative polarity high voltage (in the following, the absolute
value of the high voltage will be given). This PMT has also been chosen for the
MINOS [2] near detector and has been extensively evaluated. The
characteristics of this PMT provided by Hamamatsu are given in
Table 4.
 Figure 32: The 64-channel
Hamamatsu H7546 PMT.
Table 4: Characteristics of the 64-channel Hamamatsu H7546 PMT.
|
| Photocathode material | bialkali |
| Window material | borosilicate |
| Spectral response | 300-650 nm |
| Wavelength of maximum response | 420 nm |
| Number of dynode stages | 12 |
| Anode size | 2×2 mm2 |
| Maximum supply voltage between anode and cathode | 1000 V |
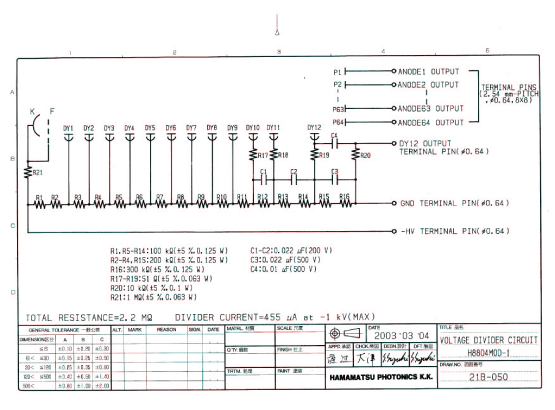
| Divider circuit | 3:2:2:1:¼:1:2:5 |
| Divider current at 1 kV | 455 mA |
| Gain at 800 V | 3.0×10⁵ |
| Cross talk (with 1 mm optical fibre) | 2% |
| Uniformity among all anodes | 1:3 |
|
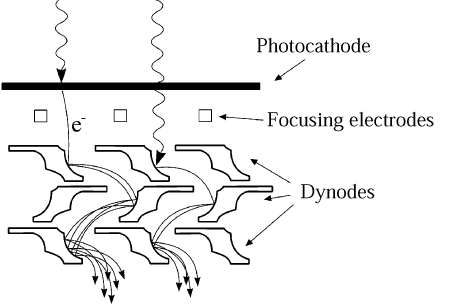
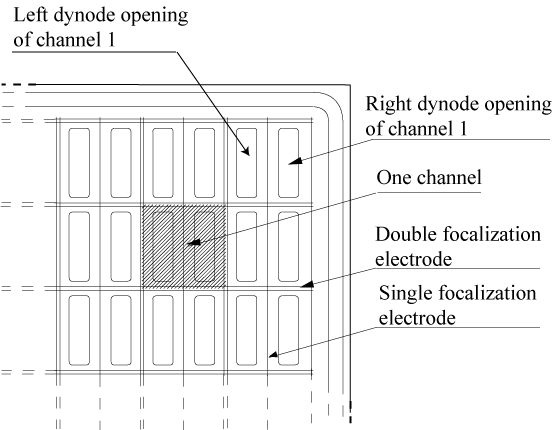
Each channel is constituted by two sets of 12 dynodes and each cell covers a
surface of 2.3×2.3 mm2 (Fig. 33 and 34).
The PMT provides an output of the last dynode number 12. This signal common to
all channels could be used as a FAST-OR to trigger the acquisition system or
for timing purposes.
.
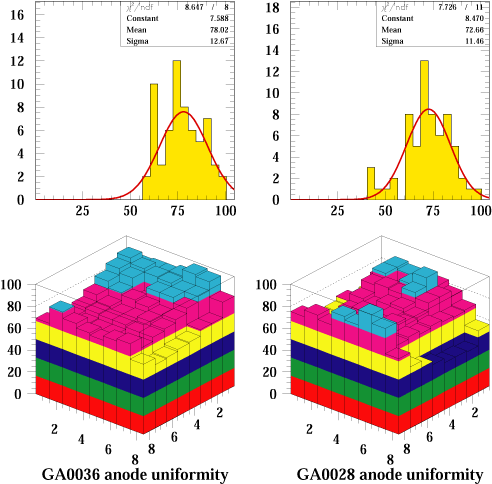 Figure 35: Response
of two 64-channels Hamamatsu H7546
PMT's, GA0036 and GA0028, at 800 V. The signal values are normalized to 100.
Advanced tests of the PMT's have been performed. Fig. 35 presents
the channel response (normalized to 100) for an anode-cathode voltage of 800 V
for the tubes under test obtained by full photocathode illumination using a
W-lamp [3].
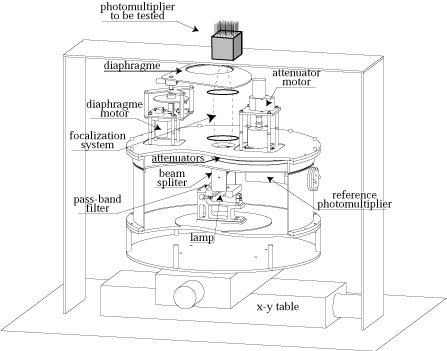
A more elaborated test system has been prepared to study in details the
multianode PMT performance. This is schematically shown in
Fig. 36. A computer guided translation system and the PMT
are enclosed in a light-tight box together with a H2 lamp, a band-pass
filter and focalization optics. With this system, a fine light spot ( < 50 mm) can be produced at any place of the PMT photocathode allowing the scanning
of the whole sensitive surface. By removing the focalization lens near the PMT,
the light beam can uniformly illuminate the whole photocathode. This option
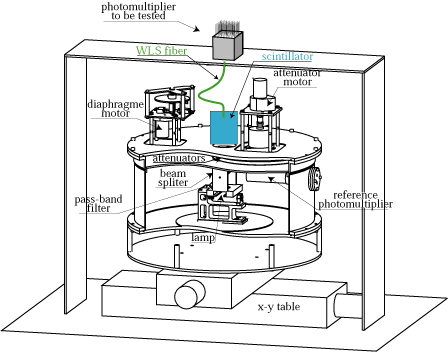
could be used for massive production tests. To be in real conditions, the PMT
can also be illuminated through a WLS fibre as shown by Fig. 37.
The H2 U.V. lamp excites a piece of scintillator in which the WLS fibre is
glued.
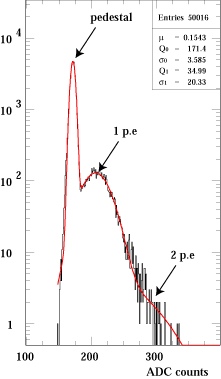 Figure 40:
Charge distribution recorded at one scanning point.
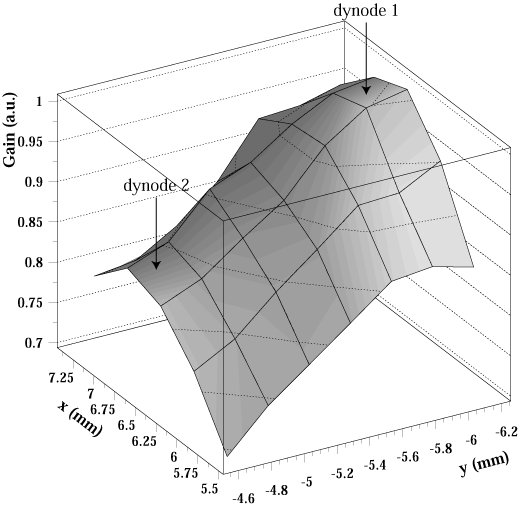
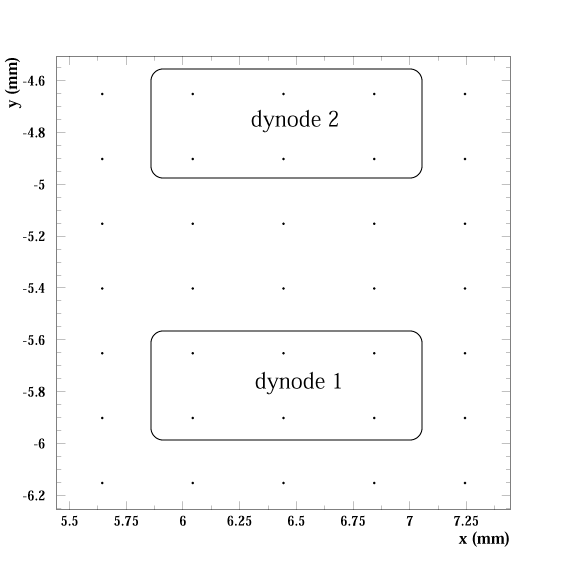
Fig. 38 presents the PMT gain after a fine scan
around channel 10 while Fig. 39 presents
schematically the scanning points and the approximate position of
the two dynodes of the channel. This scan has been done using a
1.0 mm fibre and reduced light intensity (single p.e level) in
order to study the p.e collection and gain variations over one
cell. Fig. 40 shows the charge distribution at one
scanning point. A gaussian distribution convoluted with a
poissonian one has been fitted for the signal. A gaussian
distribution has also been used for the pedestal. The number of
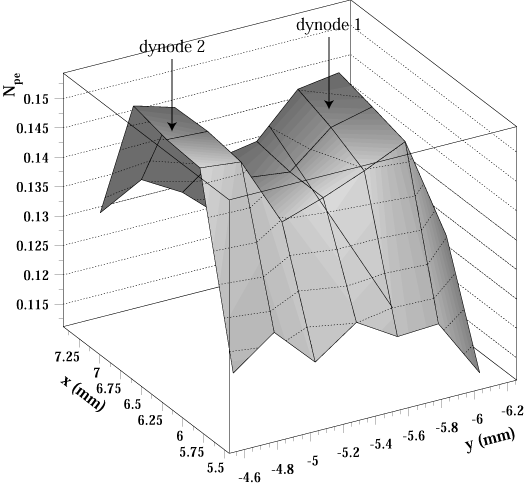
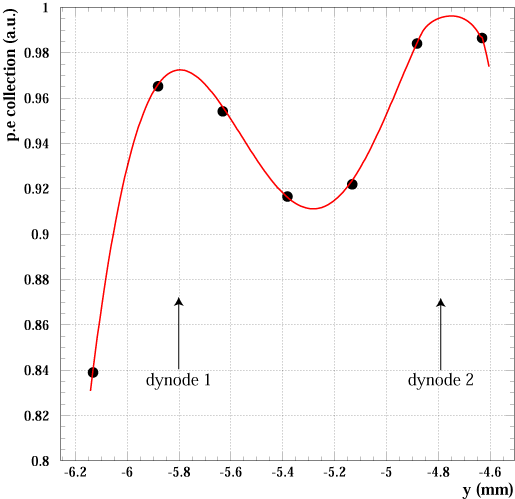
p.e collected at each position is presented by Fig. 41
while Fig. 42 gives the same number over a line
passing by the middle of the two dynodes. A loss of p.e collection
of the order of 6% is observed when the fibre is positioned
between the two dynodes as it will be in the experiment.
Fig. 43 presents the gain at 850 V observed on
all channels when the fibre is in front of each dynode and at the
middle of the two. The maximum dispersion between the two dynodes
of the same channel is of the order of 20%. On the same figure
the gain resolution (rms of the signal gaussian distribution) is
also given.
The counting rate induced by natural radioactivity or PMT dark current must be
as low as possible to reduce the effect of dead time. Using the PMT with a
threshold corresponding to 1/3 of photoelectron (p.e), a noise less than
10 Hz/channel at 25oC has been measured coming from photocathode
thermoemission. This possibility of using a low threshold ensures a very high
single p.e detection efficiency.
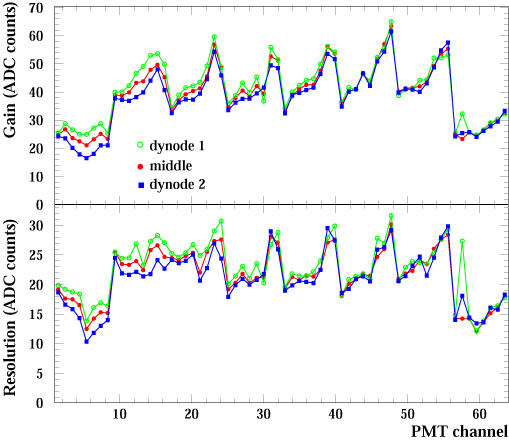 Figure 43: Gain and resolution of each PMT channel when the fibre is at
the middle of the channel and in front of each dynode.
Geometry of the OPERA PMT's:
In order to fix the PMT's on the cookies and well align the channels in front
of WLS fibres, OPERA made some requests to Hamamatsu for modifications
concerning essentially the plastic box surrounding the PMT's. Some other
modifications have also been requested concerning the back plane connectors.
Fig. 44 and 45 show the final OPERA multianode
PMT layout.
In its commercial version, the PMT is screwed on its housing plastic box by 4
screws in the back plane. The PMT is also enveloped by a teflon ribbon and a
black foam. Despite that, the PMT and especially the photocathode plane far
away from the 4 screws could move inside the plastic box. To avoid this
problem, OPERA has asked Hamamatsu to put black, high voltage resistant resin
in the space between the PMT and the plastic box (Fig. 46). In
this way, not only the PMT will remain well aligned with the fibre cookie, but
also the black resin prevents light to enter from the back plane.
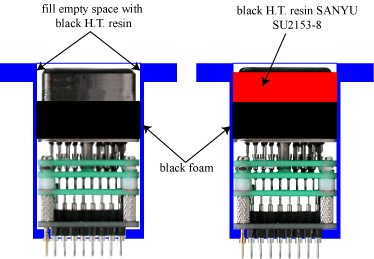 Figure 46:
OPERA multianode PMT modification for better alignment and light
tightness.
Reception tests of the PMT's:
After reception, all PMT's will pass a number of tests. First, the position of
the phototube inside its housing could vary by some tenths of a mm with respect
to their reference position. To align accurately the fibres with respect to the
focalization electrodes (considered as the best reference inside the PMT) in
front of the PMT channels (Fig. 34), a positioning device has
been prepared which allows to determine the precise (O(10 mm)) location,
where a PMT has to be attached on the cookie. In this device, the PMT (fixed in
a frame) is shifted in X-Y underneath two crossed wires in a microscope until
the wires match with the fiducial marks of the focalization electrodes inside
the PMT. Two holes are then drilled in the "ears" of the PMT housing, where
pins are attached that will match with the two predefined pinholes in the
cookie (Fig. 47).
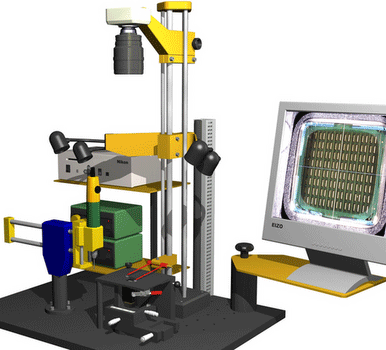
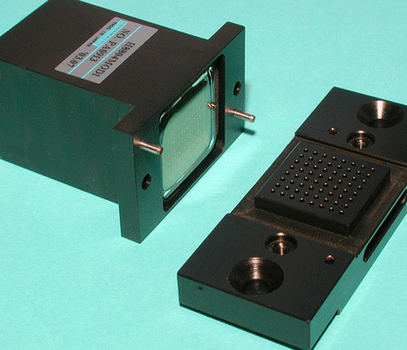 Figure 47: Left:
positioning device with 'NICON DN100' camera and a zoom lens,
right: H7546 with
pins mounted, sample cookie with pinholes.
Another device was built to obtain detailed knowledge about every PMT's
performance. The 64 WLS-fibres in a cookie are divided into 8 groups of 8 which
are arranged on the cookie in such a way that no neighbouring fibres belong to
the same group. Each group of fibres originates in a separate light diffusion
box that contains two UV-LEDs7, where the fibres are
exposed to light on a length of 2 mm. The intensity of the light pulses can be
varied by a factor of about 250 by means of the control voltage applied to the
pulser circuits (see subsection 1.3.7) which are attached to the PMT
test device. The position of the two LEDs with respect to the fibres was chosen
such as to extend the dynamic range of the system to about 4000 (0.03 p.e. -
120 p.e). Two additional fibres are arranged across each box at a distance of
3 cm from the two LEDs and lead to two reference PMTs (Hamamatsu H1949). A
cylindrical piece of scintillator, containing a weak, 30-40 Bq, Bi-source
(electrons internal conversion), placed between the fibres and the PMT window,
provides a reference signal, which allows to monitor the LED intensity,
independently from the PMT gain. In addition to the light tight Al-box in which
the whole system is packed, each fibre is protected with a black plastic tube,
to avoid optical cross-talk. The amplifier box, in which the tested PMT is
plugged, is mounted on two rails, that allow it to move towards and away from
the cookie (Fig. 48).
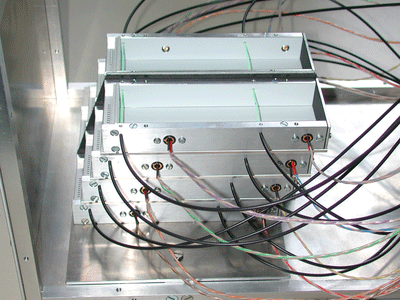
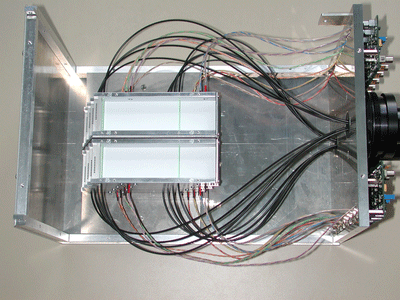
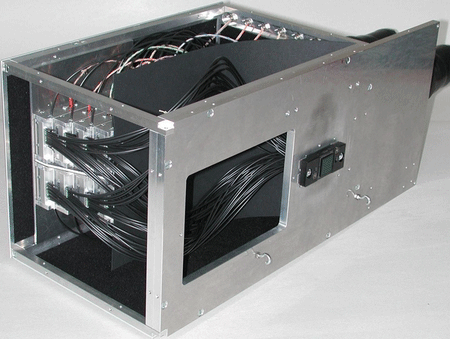
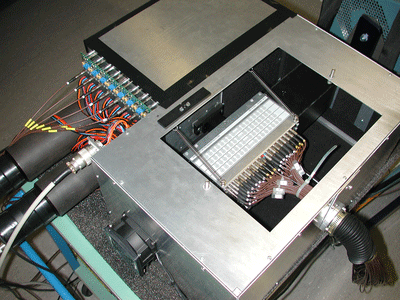 Figure 48: PM test device. Top:
staggered LED-boxes with the fibres
leading to the reference PMTs before the fibres leading to the cookie are
mounted. Bottom: 64 fibres installed and complete setup with
amplifier box.
The main goal of the PMT tests is to determine the absolute gain of each
channel. In the OPERA detector, the high voltage will be set in a way that the
gain of the strongest channel of each PMT equals 106. The gains of the 64
channels will be electronically equalized by means of the front end chips
(see 1.3.6). Along with the gain, other important characteristics
are measured, such as cross-talk (x-talk) and dark-current. The fully
automated test consists of several steps:
-
Pre-test: Find approximately (within ±10V) the negative polarity high voltage (HV0),
where the gain of the strongest channel equals 106.
-
Absolute gain calibration: Measured at HV0+30 V, with an
average light intensity of about 2.4 p.e. The spectra are fitted with a
function similar to the one given in [4]. Only 8 channels (one LED
group) are lighted at the same time.
-
High Voltage curve: 5 runs at @ 17 p.e. between HV0-30 V and HV0+30 V are used to determine
the HV-curve of each channel (8 channels lighted at the same time).
-
Relative quantum efficiency: Knowing the relative light yield of the 64
fibres, the gain calibration together with the last point of the HV-curve
(HV0+30 V) allow to determine the relative PMT quantum efficiency.
-
Cross-talk: Two runs serve for the x-talk measurement: The last one from the
HV-curve (HV0+30 V) and a run with increased light intensity ( @ 100
p.e.) at HV0. The average x-talk to each side, as well as the correlation
between the two runs are evaluated.
-
Linearity: The PMT linearity is checked by triggering all the LED groups together
without changing the HV and LED pulser settings from the second x-talk run
( @ 100 p.e, HV0) and by comparing the resulting signals at the dynode
12 with the previous run.
-
Dark-current: Events are acquired during 20 seconds, triggering on
the signals at dynode 12 with a threshold of about 0.3 p.e.
A full test takes less than one hour. All relevant results will be stored in a
data base and will mainly be used during the calibration of the Target Tracker
modules.
Strategy to select the PMT High Voltage:
Two ways for choosing the PMT operating High Voltage have been considered. In
both options, after applying the equalization factors in the front-end chips
(see 1.3.6), all channels are in an equivalent gain of 106. The
equalization factors vary from 0 to 3.
-
Option 1: The PMT channel with the highest gain is adjusted to
106 by varying the PMT High Voltage. Using the equalization factors
ai with 1 £ ai £ 3, all the other channels are adjusted to
an equivalent gain of 106.
-
Option 2: The High Voltage is adjusted in a way to have the gain
mean value of all the channels at 106. The equivalent gain of each channel
is put at 106 by varying ai between 0 and 3.
The disadvantage of Option 1 comes from the fact that only a part
of the available range of a's is used (1 £ ai £ 3), while for Option 2, all the range (0 < ai £ 3) can be
used and thus, better equalize all the channels. Of course, if
Hamamatsu respects the given PMT specifications, the ratio between
the minimum and maximum gain between the channels of the same PMT
must not exceed a factor of 3, in which case ai would only
have to vary between 1 and 3. The significant advantage of Option
1 compared to Option 2 is that in average, the High Voltage will
be lower by about 40 V. Taking into account that the dark current
increases exponentially with the High Voltage and in order to keep
the trigger rate as low as possible, Option 1 has been chosen.
To avoid problems during time, it has been decided to do not apply
optical grease between the cookie and the PMT photocathode. This
choice causes the loss of about 15% on the number of observed
photoelectrons.
High Voltage modules:
For the high voltage power supply of the PMT's, small modules
located on the DAQ board in the end-caps have been selected. The
modules had to fulfill some requirements to power properly the
PMT's.
Main requirements for the PMT:
-
The output voltage (negative polarity) must be adjustable
from 0 to 1000 V (the nominal value for the PMT is 850 V) by means of an
external control voltage not exceeding 5 V.
-
The accuracy of the output
voltage must be ±1%, the ripple less than 0.01% peak-to-peak and the
temperature coefficient should not exceed ±0.01% °C.
-
The modules must deliver an output maximum current between 1 mA and 2 mA and must
be overload and short circuit protected.
Other requirements:
-
The space allocated to the modules on the DAQ board is very limited and
thus, the modules must be able to fit in a volume of less than 110×40×20 mm3.
-
The modules will be powered by a low voltage DC supply. The value of this low
voltage must be in the range between 12 V and 24 V, and up to ±10% deviation
from the nominal supply voltage must be tolerable.
-
The efficiency must be
higher than 50% to avoid too much local heating.
-
The reliability of the
high voltage power supply modules is very important to avoid to change a
failing module during the 5 years of data taking. The Mean Time Between Failure
(MTBF) has been fixed at at least 300'000 hours at full load and 25
°C. A burn-in procedure during at least 24 hours at maximum charge
with temperature cycling has to be done by the company for each module. The
goal of this procedure is to screen for infant mortality related failure
(Fig. 49) .
-
A warranty of 1 year minimum is required.
-
The total number of high voltage modules ordered including spares is 1040.
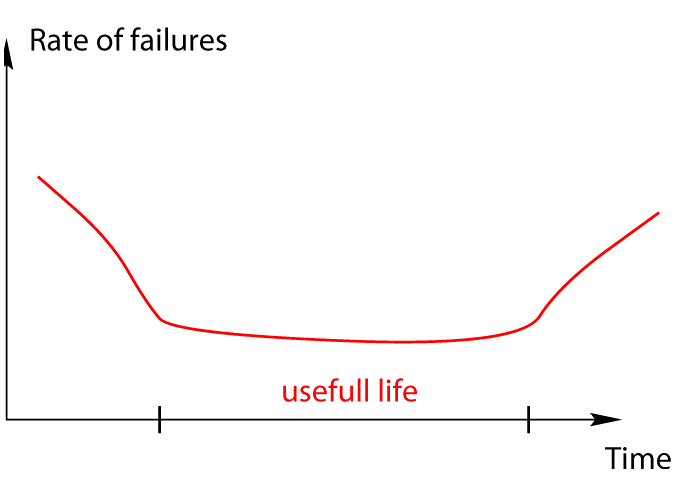 Figure 49:
Schematic view of failure rate versus use time.
Three modules produced by different companies (Iseg, Traco, Spellman) have been
tested among others. The output/input linearity, the output voltage setting and
the noise have been measured before and after a burn-in procedure in order to
check their stability after aging. The burn-in procedure was the following
(around 7 days):
-
96 ON/OFF cycles at 60 °C, with 30 minutes ON
and 15 minutes OFF
-
8 cycles at Iout = 2 mA and Vout= 900 V
with:
-
T = -15°C during 5 hours
-
Transition 1 hour
-
T = 75°C during 5 hours
Fig. 50 shows the ripple measurement before and after the burn-in for
the 3 tested modules. A good stability is observed for the ripple with the Iseg
and Traco modules. The random structure of the noise for these two modules is
also interesting to avoid resonances with the other electronic components. The
output/input linearity and the output voltage setting showed also a good
stability.
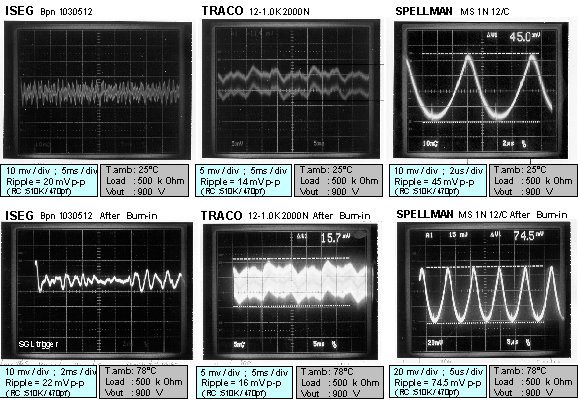 Figure 50: Noise shape
for the three modules tested, before (top) and after (bottom) burn-in.
Finally, only the module of the german company Iseg fulfills completely the
requirements (Fig. 51). As required, Iseg will proceed to a burn-in
for each module, under load (Vout= 1000 V, Iout= 1 mA) with
temperature cycling, during 48 hours. The output voltage of the Iseg modules is
not limited by hardware but it has a kill function which allows to cut this
output voltage in case of unexpected increase. It is important to limit this
output voltage to avoid damage on the PMT. This function has been tested under
1 MW load and the measured settling time was around 150 ms which is
enough to protect the PMT.
 Figure 51:
Technical data of the Iseg High Voltage module.
1.3.6 Front-End Electronics
The readout electronics of the Target Tracker is based on a
32-channel ASIC, referenced in the following as the OPERA Read Out
Chip (ROC). Two ROC's are used to readout each multianode
photomultiplier tube (PMT), for a total of 1,984 chips for the
full detector. A detailed description of the ASIC design and
performance can be found in [9,10,11].
The main requirements driving the chip design are the following:
-
the chip must correct the signal for anode-to-anode gain
variations;
-
it must deliver a global auto-trigger and time
information with a 100% trigger efficiency for particles at
minimum of ionization (MIP);
-
the chip must deliver a
charge proportional to signal delivered by each pixel of the PMT
in a dynamic range between 1 and 100 photoelectrons (p.e.).
PMT pixel-to-pixel gain variation have been measured with a
specific test bench described in [7] and shown to be
as large as 3 (Fig. 43). In order to compensate
this large difference between channels, the front-end electronics
must be equipped with an adjustable gain system, directly
incorporated in the preamplifier stage. This allows good
integration density and delivers a signal of identical range to
the fast and slow shaper of every channel.
The auto-trigger stage has been designed to be a low noise, 100%
efficient in the detection of particles at minimum of ionisation
(MIP). These characteristics require a 100% trigger efficiency
for a signal as low as 1/3 of p.e, which corresponds to 50 fC at
the anode for a PMT gain of 106. Besides, we aim at a front
end approaching a signal to noise ratio of 100 for 1 p.e. signal,
which would allow an auto-trigger at a level of 1/16 of p.e, much
lower than 1/3 of p.e signal required for the OPERA experiment.
Finally, a dynamic range of the charge measurement up to about
100 photoelectrons is required, which corresponds to 16 pC at a
PMT gain of 106. This should allow to distinguish MIP from
particle showers, and provide a measurement of the energy
deposition in electromagnetic showers relevant for brick finding
and event classification.
OPERA ROC global architecture and main features:
The Read-Out chip is a 32-channel ASIC with individual input,
trigger and charge measurement, that returns to the ADC a
multiplexed output of all channels.
Single channel architecture comprises a low noise variable gain
preamplifier that feeds both a trigger and a charge measurement
arms (Fig. 52).
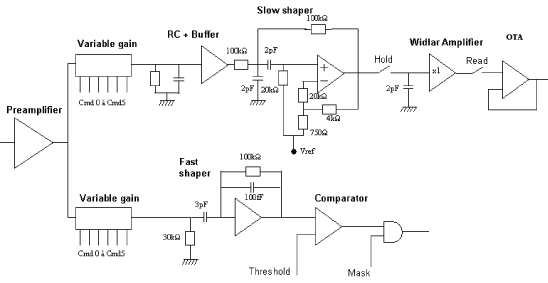 Figure 52: Architecture of a single channel.
The auto-trigger includes a fast shaper followed by a comparator.
The trigger decision is provided by the logical "OR" of all 32
comparator outputs, with a threshold set at once externally. A
mask register allows at this stage to disable externally any noisy
or malfunctioning channel.
The charge measurement arm consists of a slow shaper followed by a
Track & Hold buffer. Upon a trigger decision, charges are stored
in 2 pF capacitors and the 32 channels outputs are readout
sequentially at a 5 MHz frequency, in a period of time of
6.4 ms.
The technology of the chip is AMS BiCMOS 0.8 mm [8].
The chip area is about 10 mm2 and it is packaged in a
QFP100 case. The chip consumption depends upon the gain correction
settings and is ranging between 130 mW and 160 mW (32 channels).
Variable gain preamplifier:
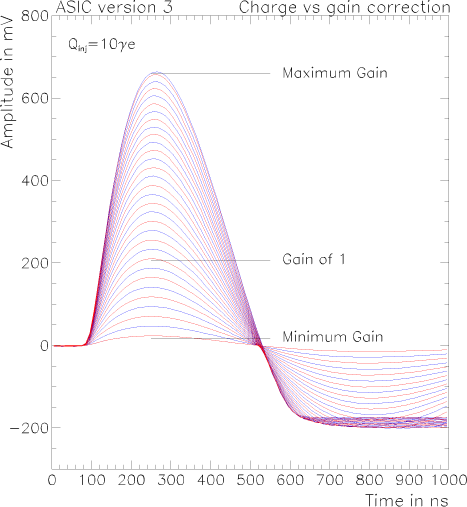
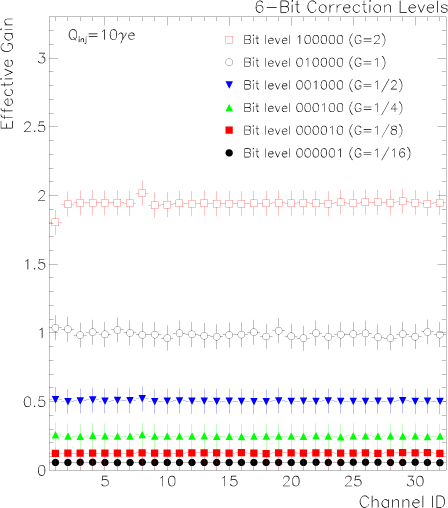
For every single channel, a variable gain system is implemented by
adding switchable current mirrors with various areas (2, 1, 0.5,
0.25, 0.125, 0.0625). The activation of the six switches thus
allows to set an effective gain correction ranging from 0 to 3.9
(the maximum effective gain has been measured to be 3.5,
Fig. 53). By turning off
all current switches, any channel can be disabled thanks to its
null gain in its input stage.
This device includes an input amplifier stage designed around a
super common base [11]. With this architecture,
the input impedance is set to a reasonably low value
(80 W) while keeping small currents circulating in the
mirror (and thereby reducing cross-talk).
Preamplifier gain is found to be 94 mV/pC (15 mV/p.e. at gain of
106) with a rise time of about 30 ns, for a correction gain
set to 1. After amplification, two copies of the input current are
made available to feed both the trigger and the charge measurement
arms. For the corresponding (slow and fast shaper) timings, the
noise RMS is found at or below 1% of p.e.
Auto-Triggering:
The fast shaper is directly fed with a mirror output via a 3 pF
capacitance and the signal is integrated in a 0.1 pF charge
amplifier. The integration time constant is 10 ns to produce a
fast signal. A differential input is used to minimize offset
dispersion and allow a common threshold for the chip with a
minimal threshold spread.
The fast shaper is then followed by a comparator, whose input
stage includes a bipolar differential pair in order to minimize
the offset. With a low offset comparator and a high gain in the
shaping just before, a common threshold can be used for all
channels. The trigger decision is defined as the logical "OR" of
all comparator's outputs and sets in the charge integration
process. A mask register has been added and allows the disabling
of any channel that should be removed from the trigger decision.
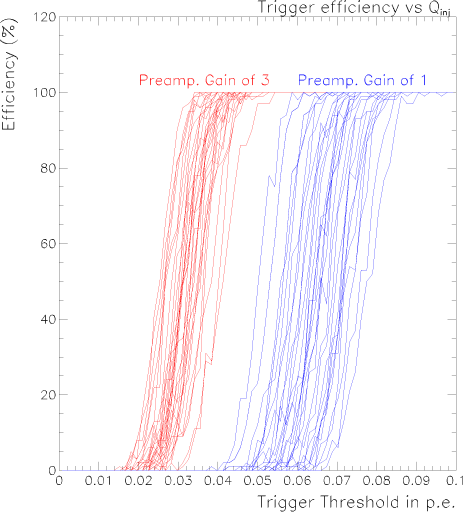 Figure 55: Trigger efficiency (S-curve) as function of the
input charge for the 32 channels for a preamplifier gains of 1 and
3.
Fast shaper characteristics are a gain of 2.5 V/pC ie: 400 mV/p.e
and a peaking time of 10 ns for a preamplifier gain set to 1. The
trigger rise-time only slightly depends on the input charge
magnitude, since increasing the signal from 0.1 to 100 p.e.
results in a 15 ns delay in the trigger decision. Given the
attenuation factor in the 6.8 meter long scintillator strips, this
delay is not expected to affect significantly the physics
measurement, since no precise time measurement is needed on the
scintillator ends.
Trigger efficiency has been measured as function of the injected
charge for each individual channel. S-shaped characteristic curves
are displayed in Fig. 55 for two
preamplifier gains, and show that a 100% trigger efficiency is
obtained for input charge as low as 1/10th of p.e., independently
of the preamplifier correction.
As the trigger threshold is set externally at once for all
channel, it is important to control the threshold spread among the
32 channels. This spread has been assessed and found around 0.03 p.e, which is satisfactory regarding the constraints on
triggering.
Fast shaper noise has been measured at 0.72 fC, ie: 0.005 p.e for
an amplification factor of 1, and 0.55 fC ie: 0.012 p.e for a gain
set to 3.
Charge measurement:
The slow shaper has a long peaking time, such as to minimize the
sensitivity to the signal arrival time. The voltage pulse
available on the RC integrator is shaped by a Sallen-Key shaper
characterized by a time constant of 200 ns. This corresponds
to an average rise-time of 160 ns with a spread among the
32 channels not exceeding ±4 ns. In order to minimize
pedestal variation from channel-to-channel slow shaper DC offset
dispersion, a differential input stage has been used.
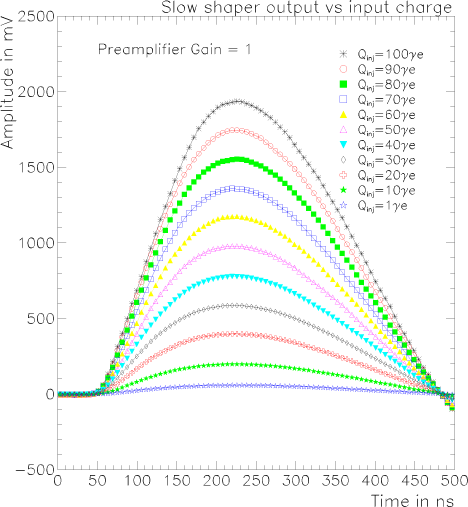 Figure 56: Slow shaper waveform outputs for different input
charge corresponding to 1, 10, 20, 30, 40, 50, 60, 70, 80, 90 and
100 photoelectrons.
|
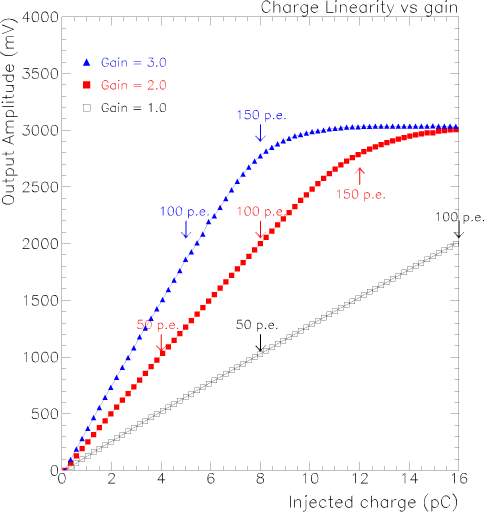 Figure 57: Linearity of the charge measurement as function of
the input charge for a gain set at 0.5, 1 and 3.0.
|
Fig.56 displays the waveform
output of a single channel for input charges ranging from 1 to
100 photoelectrons with a preamplifier gain set to 1. The slow
shaper is followed by an improved Track and Hold (T and H) buffer
and a multiplexed output. The T and H architecture offers two
options, that can be set by the use of a hardware switch on the
input and output common to all channels: a classical T and H makes
use of a Common Collector configuration, while a second is based
on a Widlar differential configuration. The use of the latter
option shows slightly better performance by reducing the
contribution of the T & H buffer to the DC voltage spread.
Upon a trigger decision, all the capacitors are read sequentially
through a shift register made by D-flip-flop. Pedestal level is
1.2 V in average, with a corresponding spread of ±6 mV. These numbers correspond to less than a 1/3rd p.e. In the
final design of the analogue board, the signal actually entering the
ADC is defined as the difference between the multiplexed output
and the Channel 0 output. This channel being disconnected from any
input, this technique allows to make measurements insensitive to
pedestal variations common to all channels (temperature effect
etc...).
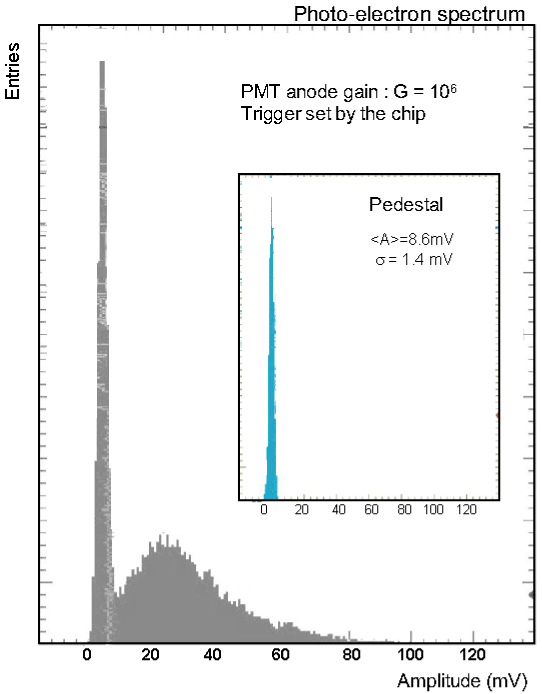 Figure 58: Pulse height distribution of the PMT signals
induced by weak LED pulses which produce one photoelectron in
average. The LED signal illuminates 8 non-neighbouring channels
of the multianode PMT. The response of only one channel is shown.
The ASIC produces a trigger if the signal of at least one channel
exceeds the threshold set to 0.015 p.e.
The linearity in the charge measurement has been determined for
all channels and found to be better than 2% over the full range
1-16 pC for a preamplifier gain of 1, corresponding to 1-100 p.e.
Pedestal subtracted full response range is extending from a few
mV, corresponding to a fraction of p.e., to 2.0 Volts for a
100 p.e. input charge. These performance show no dependence to the
preamplifier gain settings, as seen in
Fig. 57
Noise at the multiplexed output has been measured at 12 fC, ie:
0.075 p.e for a preamplifier gain 1, and at 3.7 fC or 0.08 p.e for
a maximal gain. Results are consistent with the expectations and
satisfactory from the physics standpoint.
Cross-talk due to the ASIC has been carefully considered. Two main
sources of cross-talk have been identified. A first effect is
interpreted as a coupling between the trigger and the charge
measurement arms, and has been determined to be lower than 0.1%.
The second one affects neighbouring channels of an hit channel
where a cross-talk of the order of 1% is measured in the first
neighbour. This effect is negligible for far channel where a
constant cross-talk component of -0.2% is observed. We conclude
however that such level of cross-talk is fully compatible with
physics constraints.
A multianode PMT has been used to test the ASIC response to a
single photoelectron signal. An analog board equipped with two
ASICs has been designed and connected to the PMT. A set of LEDs
has been used to illuminate 8 fibers simultaneously inside a black
box. The trigger is provided by the ASIC as the OR of all 8
channels and allows to record the pulse height distribution
obtained for weak LED pulses which produce one photoelectron in
average. This spectrum contains 38% of events with no
photoelectron which produce the sharp pedestal peak."
Fig. 58 displays a photoelectron spectrum
including pedestal.
Table 1.3.6 summarize the performance as measured
on the 32 channel chip.
Table 5: Performance of the OPERA ROC.
| PREAMPLIFIER | |
| - Gain correction | Range 0-3.5 (6 bit resolution) |
| 2,1,1/2,1/4,1/8,1/16 |
| - Input for Test Pulse | 3 pF alternate (even/odd channels) |
| - Input Impedance | Zin » 100W |
|
| AUTO-TRIGGER: | |
| - Fast shaper peak time | 10 ns |
| - Fast shaper gain (Gain 1) | 2.5V/pC (400 mV/p.e.) |
| - Threshold spread | 0.03 p.e. |
| - Fast shaper noise (Gain 1) | 1.8mV (0.72fC or 0.005p.e) |
| - Trigger sensitivity | 100% at 0.1 p.e. |
| - Hit Register | Implemented |
|
| CHARGE MEASUREMENT: | |
| - Dynamic range (Gain 1) | 16 pC (100 p.e) |
| - Slow shaper peak time (Gain 1) | 160 ns |
| - Slow shaper Gain (Gain 1) | 120 mV/pC (19 mV/pe) |
| - Pedestal Spread (mV) | ±6 mV (widlar) / ±9 mV (CC) |
| (±0.4-0.5 p.e.) |
| - Noise @ MUX rms (Gain 1) | 1.3 mV (12fC or 0.075p.e) |
| - Cross-talk | O(1%) |
|
| Linear Voltage range @ MUX | about 2.2 V to 4.2 V |
| Clock frequency | 5 MHz (6.4ms/32ch.) |
Front-end board:
The front-end board is a 8-layer PCB carrying two ROCs, which is
directly plugged to the PMT, as shown in Fig. 59.
The lines from the PMT to the ROC inputs are well separated and
protected from external noise sources by four ground planes in the
PCB. The front-end board contains buffer amplifiers for the
differential charge output signals of the ROCs and logic level
translators for the digital signals. It also carries five
operational amplifiers, four for adapting the output voltage range
of the two DACs on the DAQ board to the threshold voltage range of
the two ROCs, and one for reading the high voltage of the PMT. The
front-end card is connected to the DAQ board by means of two
26-lines miniature flat cables. The ADCs are located on the DAQ
board, in order to minimize the length of the data bus.
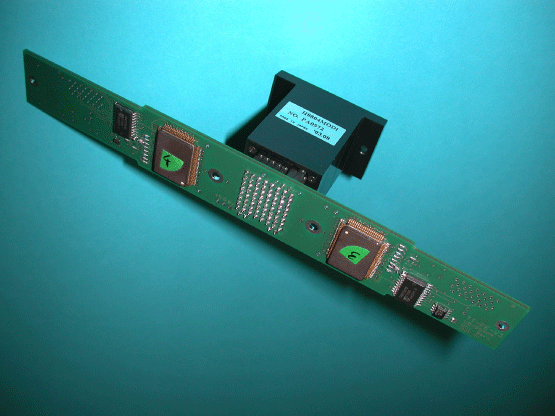 Figure 59: The front-end PCB connected to a multianode PMT.
1.3.7 Light Injection System
The role of the light injection system is to test and monitor all
the electronic channels and the data acquisition system.
In each end-cap, light is injected in the WLS fibres just in
front of the cookie with the help of LED's, light guides and a
white painted diffusive box. The LED's are pulsed from outside the
end-cap by a purposely designed driver activated by an external
trigger.
The gain monitoring of each PMT channel and its associated
electronics can be performed in a very short time in the single
p.e. mode and up to about 100 p.e. By pulsing LED's on one side of
the module and reading the signal on the other side, a possible
WLS fibre ageing can be monitored. This system will also be
particularly helpful for detector and DAQ debugging during the
detector installation.
The system is designed to provide a rather uniform (within about a
factor 3) illumination of all 64 fibres bundled in a 8×8
dense pattern near the optical window. In order to avoid
encumbering the vicinity of this window during the delicate
process of fibres insertion in the cookie holes, it can be
installed at a late stage of the assembly.
The light injection system will regularly be operated during the
whole experiment duration.
Geometry:
Fig. 60 shows schematically the light injection
system. It is left-right symmetric with respect to the fibre
bundle and each side is composed of one LED type Kingbright
L-7113PBC and one straight 6 mm diameter and 50 mm long PMMA light
guide. The light guides enter a 300 mm long and 23.4×23.4 mm2 section aluminium box coated with TiO2 diffusive
paint. The end faces of the box are black painted to limit the
amount of light reaching the fibres.
Two rectangular openings in the front and back faces of the box
provide a passage for the bundle of fibres. To allow its
installation after the construction of the optical window, the box
is actually composed of two symmetrical halfs that are assembled
around the fibres bundle. Figure 61 shows the
geometry of one half system.
LED Pulser:
The LED pulser provides fast blue light pulses with an amplitude
range of more than a factor of 200, with a stability and
reproducibility of about one percent at the high and medium
amplitudes and a few percent at the lowest amplitudes. Out of
several tested types of modern blue LEDs, the L-7113PBC produced
by Kingbright was found to be the best for producing fast light
pulses. The circuit, which generates the current pulses for the
pair of LEDs of the light injector, is based on standard fast
amplifier chips, needs only ±5 V supplies and fits on a PCB
area of 25×50 mm2. The main features of this circuit
can be understood from the simplified circuit diagram shown in
Fig. 62 and are discussed in the following.
The pulser requires a LVDS trigger signal with a width of 20 ns.
The stability of the width of the trigger pulse is important for
the stability of the LED signal. This pulse is converted to 3.3 V
CMOS levels by the LVDS receiver DS90LV018A. The limiting
amplifier AD8036 produces a pulse with an amplitude given by the
voltage at the VH - input. This pulse is amplified by
a factor of +2.3 and -2.3 respectively by the two sections of the
dual amplifier AD8012, the differential signal at these two
outputs being used for driving the LED. The offset voltages at the
two outputs of the AD8012 are set to -3.4 V and +3.4 V
respectively, which allows for a maximum voltage swing at both
outputs of about 7 V, i.e. a maximum LED driving signal of about
14 V. The two 47 W series resistors and the dynamic
impedance of the LED limit the maximum current to about 95 mA,
which is compatible with the output drive capability of the
AD8012. A second identical output stage not shown in the
simplified circuit diagram drives the second LED of the light
injector.
The capacitance of about 70 pF and the forward voltage of 2 to 4
volts of the LED complicates the design of a fast light pulser
with a big dynamic range and a good stability. We use the
superposition of a very short and constant current pulse, for
getting the LED from the idle state to close to light emission,
and a 20 ns wide variable pulse, which determines the light
amplitude. This is achieved by AC-coupling the 3.3 V pulse at the
output of the LVDS receiver with a time constant of only 1.8 ns to
the limiting voltage Vlimit, making use of the fast
response of the amplifier AD8036 to the signal VH at
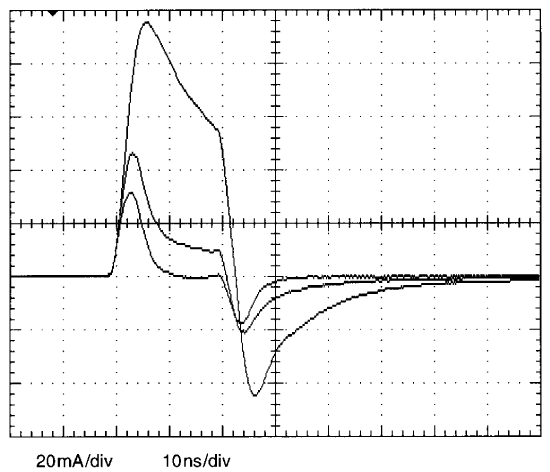
its limiting input. Fig. 63 shows the resulting LED
current signals for maximum light output, and for 10% and 1% of
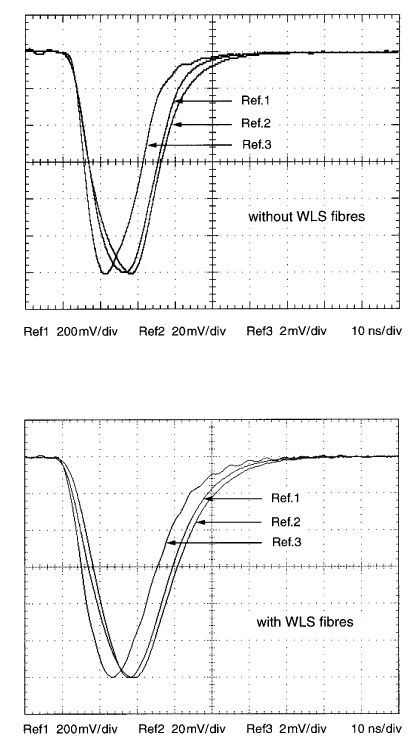
the maximum light output. Fig. 64 shows the
corresponding light pulses without and with wavelength shifting
fibres. For a good stability of the fast part of the current pulse
generated in this way a very stable 3.3 V supply voltage of the
LVDS receiver is required. Therefore a 3.3 V regulator chip with
adequate quality is part of the LED pulser circuit.
A bias voltage between about 0.5 V and 1.5 V is applied to the
LED, which reduces the required charge delivered by the fast part
of the current signal for getting from the idle state to close to
light emitting. This bias voltage is used for setting the dynamic
range of the pulser. It can be adjusted individually for the two
LEDs of the light injector, which allows to equalize roughly the
response to Vlimit of the LED pair. The control
voltage Vlimit is provided by a DAC on the DAQ card.
The spread of the absolute light output of 2500 LED's type
L-7113PBC purchased for the Target Tracker was found to be within
a factor of two. Also the relative light output as a function of
the DAC setting can differ up to a factor of two for two arbitrary
chosen LED's. In order to improve the uniformity of the light
injection by the pair of LED's into the 64 WLS fibres, we
subdivided the 2500 LED's into three absolute light yield
categories, which we further subdivided into three categories of
similar, i.e. within about ±20% equal dependence on the
control voltage. The two LED's per light injector will be chosen
from one of these nine categories. Adequate filters will be used
for equalizing the absolute light output of the three light yield
categories. In this way the spread of the maximum light signal
produced by the LED's will be reduced to about ±15% for all
injectors, and the relative light signals of the LED pairs as a
function of the DAC setting will track within about ±20%.
Fig. 65 shows the dependence of the light output on
Vcontrol of a typical LED pair.
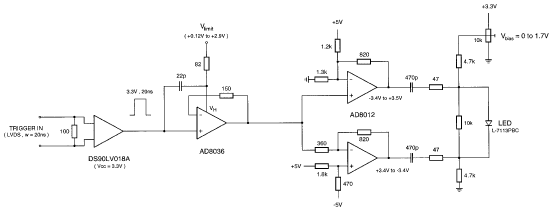 Figure 62: Simplified circuit diagram of the LED pulser. Only
one of the two output stages for the LED pair of the light
injector is shown.
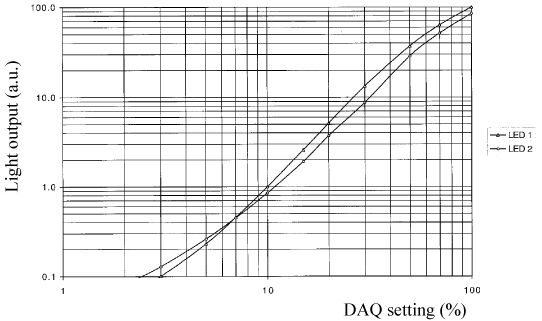 Figure 65: Dependence of the light output of a typical light
injector LED pair on the control voltage, which is produced by a
DAC on the DAQ card.
Results on uniformity and dynamic range with the complete
system:
The preliminary set-up used to check the injection system did not
allow to correct for the pixel to pixel gain variation of the PMT,
contrary to the front-end electronics described in section
1.3.6. The charge distribution was recorded 12
channels at a time using a LeCroy 2249A CAMAC ADC. To study the
high part of the dynamic range, signals were passed through a CAEN
N147 attenuator in order to avoid ADC saturation.
The analysis of the ADC spectra proceeds as described in section
1.3.5: at low intensity, the pedestal and the one
p.e. signal are fitted with gaussian distributions; at high
intensity, the spectra are fitted with the convolution of the one
p.e. signal with a Poisson distribution to obtain the number of
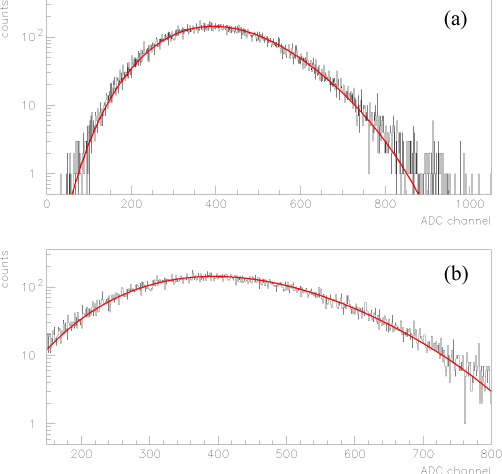
p.e Npe. An example of such a fit in shown in figure
66.
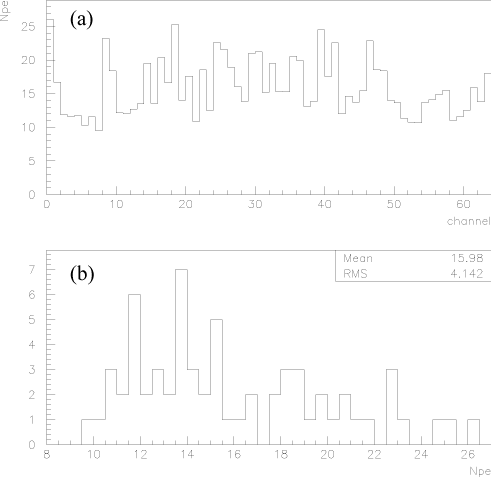
Figure 67 shows the number of p.e. obtained
channel by channel when a pulsed voltage of 2.0 V is applied to
the LED. The distribution of this number, also displayed, has a
mean of 16.0 p.e. and an RMS of 4.1. The ratio of 2.7
between the two extreme values satisfies the requirement.
The variation of the response of one channel as a function of the
control voltage applied to the LED is displayed in figure
68. The non linear response below 20 p.e. makes
the amplitude setting at the lower end of the range less critical.
Signals as low as 0.02 p.e can be extracted from the background.
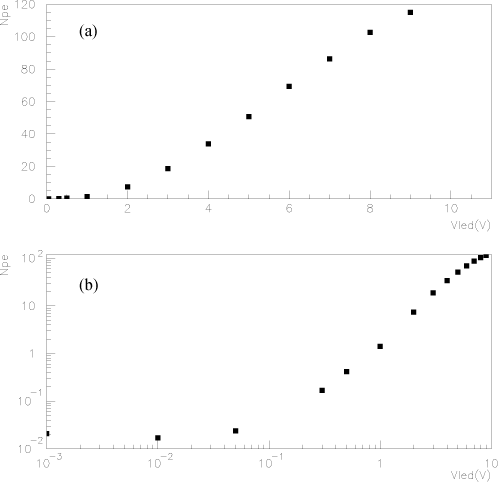 Figure 68: Response of one channel as a function of the voltage applied to
the LED, a) linear scale showing the linearity at high voltage, b) log/log
scale showing the sensitivity at low voltage.
1.4 Effect of the magnetic field on PMT's
The fringe magnetic field of the OPERA spectrometers could
deteriorate the multianode PMT performance. Simulations have
revealed that, indeed, the magnetic field value at the place
where the Target Tracker PMT's will be located is not negligible.
This study is divided in two parts, the first one deals with the simulation of
the magnetic field generated by the two OPERA muon spectrometers where several
shieldings have been investigated to protect the PMT's. In the second one, the
effects of the magnetic field on the PMT characteristics have been measured
without and with shielding.
1.4.1 Magnetic field of the spectrometers
The two muon spectrometers of the detector have already been simulated with
TOSCA [15,16] using the finite element method. Here, the
simulation of the fringe field generated by the two spectrometers whose
geometry is shown Fig. 69 was realized with
AMPERES [17] based on the boundary element method.
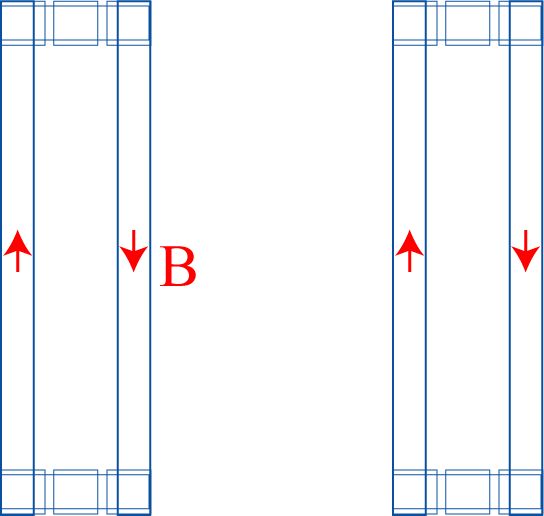 Figure 69:
Geometry of the two spectrometers.
The original model contains 2×11 slabs/magnet with space in between
for RPC's (inner tracker). Due to the big slab dimensions compared to the thin
space in between them, some convergence problems have been met during
calculations. To simplify the geometry and avoid problems, one can consider
walls with the same magnetic reluctance of 11 slabs. In this case, the
magnetic flux circulating in the wall remains the same. The current in the
coils was 1380 A. The wall is made of special steel whose induction curve is
shown Fig 70.
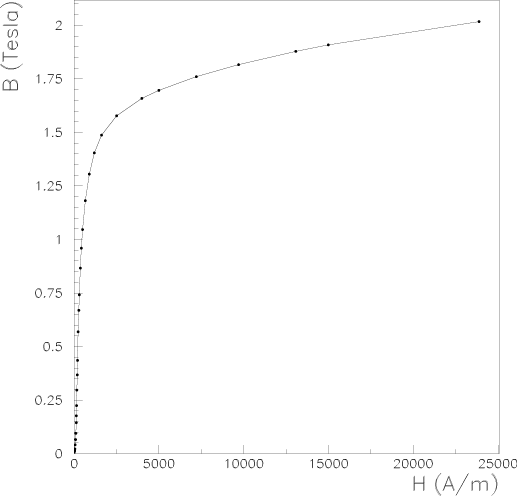 Figure 70: Induction curve of steel Fe GM01 UNI 3595.
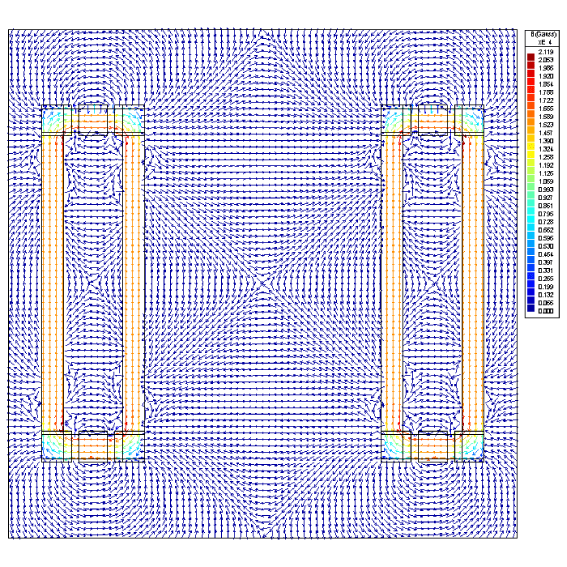
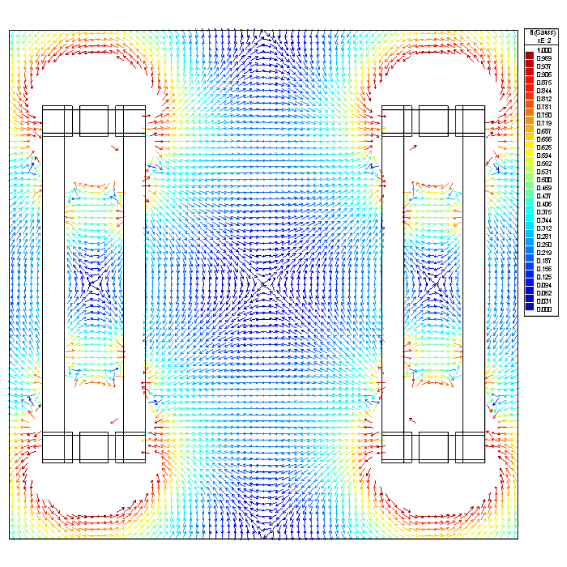 Figure 71: Magnetic map:
The simulation provides 1.55 T (Fig. 71a) in the walls
corresponding to the measured intensity in the magnet
prototype [18]. On Fig. 71b) one can see that
the fringe field is more intensive close to the coils.
1.4.2 Magnetic field at PMT position
According to MINOS [20] and
Hamamatsu [19] measurements, the component of
the magnetic field perpendicular to the PMT photocathode is the
most dangerous one. Both studies indicate that the light
detection efficiency decreases significantly if the magnitude of
this component exceeds 5 Gauss.
The magnetic field around the detector for different coil
currents has been calculated. Fig. 72
presents the maximum (Bmax) and the minimum (Bmin)
values of the magnetic field in the target zone as a function of
the current in the coil.
According to the detector symmetry, this study will be divided in
two parts, one concerning the top PMT's with numbers 1, 2, 3, 4
and the other concerning the PMT's located on the detector's side
with numbers 5, 6, 7, 8 (Fig. 73). For each of
the eight positions, the curve |B|=f(xi,yi,z), where
(xi,yi) indicate the position in the vertical plane of the
ith PMT row and z the coordinate along the neutrino beam
axis, can be calculated. An example of these curves is shown by
Fig 74. The different values given by the
simulation are summarized in Table 6 where one can
see that the magnetic field can go up to 40 Gauss. This justify
the necessity of shielding the PMT's. The curve of PMT number 3
will be taken as reference in the following (worst case).
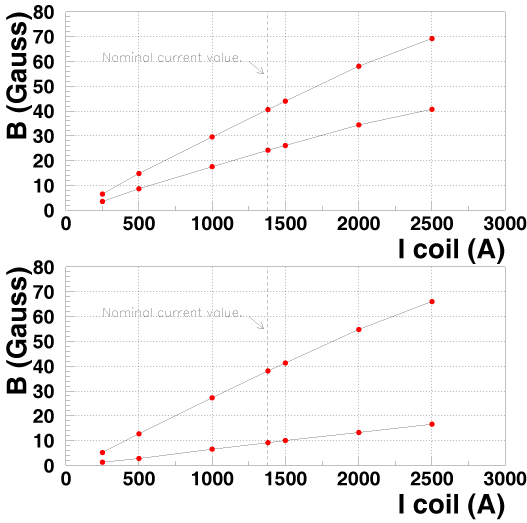 Figure 72: Magnetic field intensity between (top) and
outside (bottom) of the spectrometers (nominal current value
Inom=1380 A).
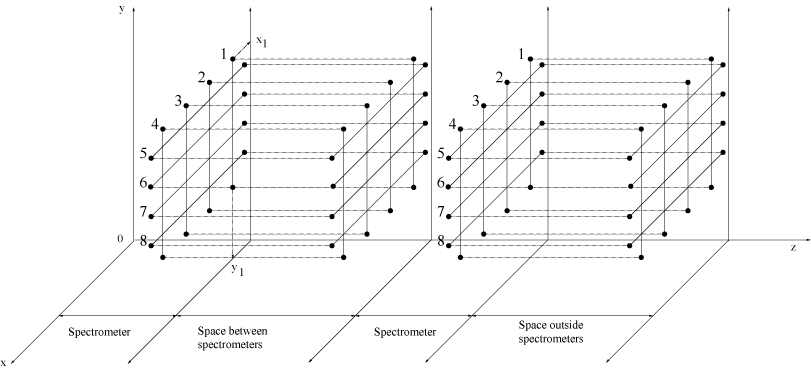 Figure 73: Numbering of the PMT's, each line represents a
row of PMT's).
Figure 74: Magnetic field intensity along the beam axis
(z) for PMT row number 3 (left,
right).
Table 6: Minimum and maximum values of fringe field
magnitude for I=1380 A in the magnet coils.
| | |
| | |B| Extreme values of the curve (Gauss) |
| | |
| | between spectrometers | Outside spectrometers |
| PMT row number | Bmin | Bmax | Bmin | Bmax |
| T | 1 | 21.5 | 38.2 | 8.7 | 37.5 |
| O | 2 | 24.0 | 40.1 | 9.1 | 38.0 |
| P | 3 | 24.1 | 40.6 | 9.1 | 38.0
|
| 4 | 21.9 | 39.7 | 8.7 | 37.5 |
| S | 5 | 16.4 | 29.0 | 6.6 | 26.3 |
| I | 6 | 6.3 | 19.8 | 3.0 | 17.3 |
| D | 7 | 6.2 | 19.8 | 2.9 | 17.2 |
| E | 8 | 16.3 | 29.1 | 6.5 | 26.2 |
1.4.3 Simulation for several PMT magnetic shielding configurations
Different possibilities for shielding of all PMT's have been
investigated. An evaluation of the magnetic induction at the
photocathode level has been performed. However the field could be
slightly different because PMT's could contain magnetic material
which could modify the flux and which could not be taken into
account by the simulation.
"Small" and "large" shielding geometry:
This two configurations are shown by
Fig 75. The first shielding ("small")
protects only the PMT with its plastic box. The weak point of
this geometry is the corners where the field intensity is very
high (Fig. 76). To solve this
problem, the shielding can be extended in order to cover entirely
the PMT and the cookie ("large" shielding). On top of that, one
could also make the reference bar in front of the cookie
(Fig. 28) in magnetic material in order to better
protect the PMT photocathode. The distribution of the field
intensity in this case is indicated by Fig 77.
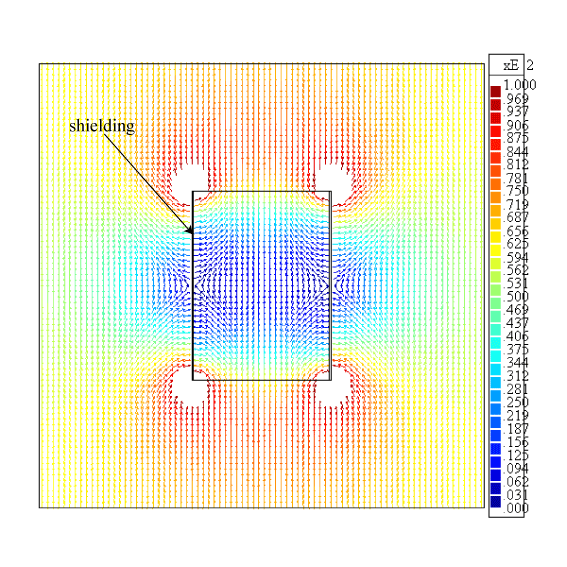
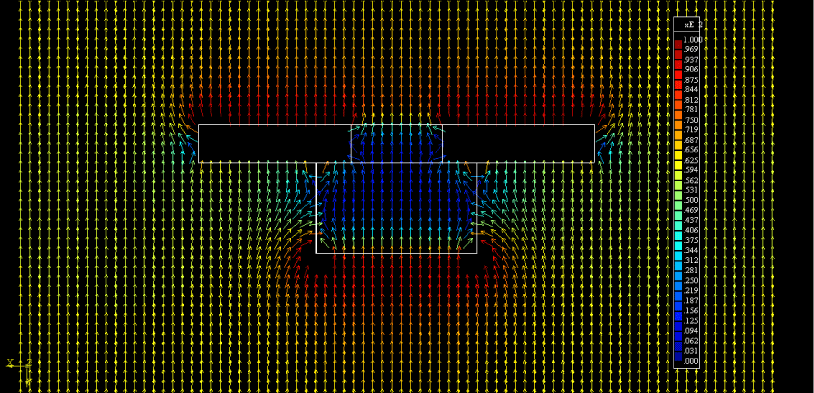
This shielding is better than the previous one but still small
edge effects remain.
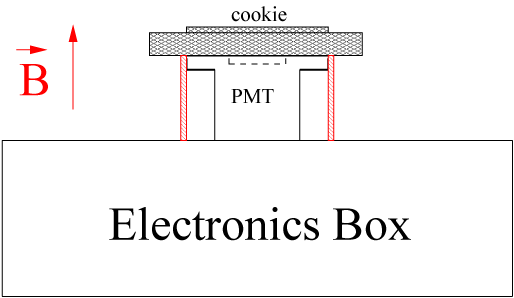
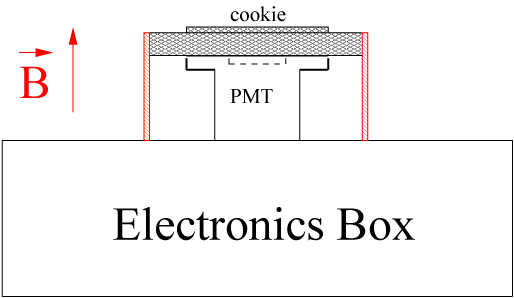 Figure 75: Small and Large shielding configurations (left,
right).
1.4.4 Experimental Results
According to the map shown in Fig 71, the magnetic field has
different directions and magnitude. The behaviour of the main PMT
characteristics have been studied by varying the direction and the magnitude
of the field.
The experimental setup uses a large enough coil, where a PMT and
its electronics can be housed, allowing to cover all the fringe
field intensity range.
PMT's characteristics with magnetic field:
The main features of PMT's are affected by a strong enough magnetic field
because the Lorentz force applied to photoelectrons modify their trajectory.
Thus, the photoelectrons are not correctly focused at the level of the first
dynode. The problem remains the same for the secondary electrons and could
affect the multiplication process.
For this study, all the PMT 64 channels were uniformly
illuminated by a blue LED.
Collection efficiency:
The degradation of the electron collection efficiency will be measured using
the ratio of the photoelectron number with and without magnetic field:
|
Re= |
m(B)
m0
|
= |
ec(B)
ec(0)
|
|
| (1) |
where m(B)= < ng > .eq.ec(B) represents the mean number
of photoelectrons, < ng > the mean number of photons hitting the
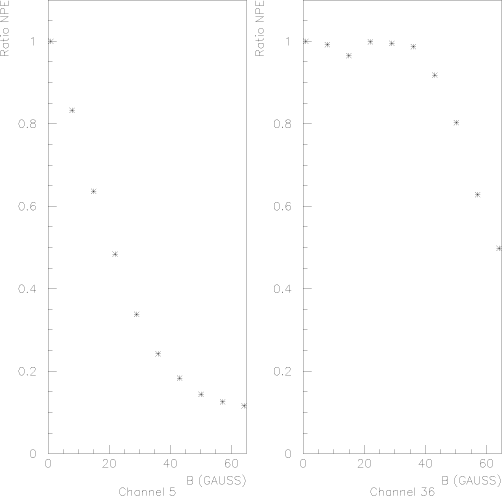
photocathode and eq the quantum efficiency. All the 64 channels were
studied and according to the measurements two typical behaviours clearly
appear and are summarized by two channels, one located on the border (channel
#5) and the other in the center (channel #36) of the PMT
(Fig. 78 and 79). The border channels
are very sensitive to the magnetic field. Those located on the central area
show no significant effect below 30 Gauss.
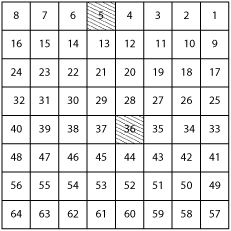 Figure 78: Localization of the two studied channels.
.
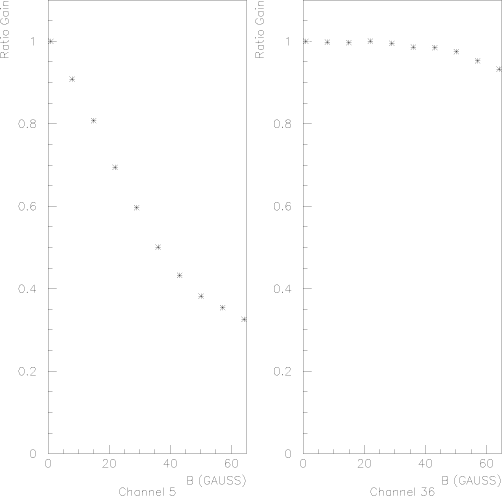
Gain:
For the gain, the same comparison is done by evaluating the ratio
where G(B) represents the PMT gain. One can see on
Fig. 80 that the gain also drops with the
magnetic field, although less strongly than the efficiency. The
central channels are again less affected by the magnetic field.
Cross-talk:
The observed drop in collection efficiency is expected to be
associated with an increase in cross-talk, a fraction of the
electrons being deviated on the neighbouring channels.
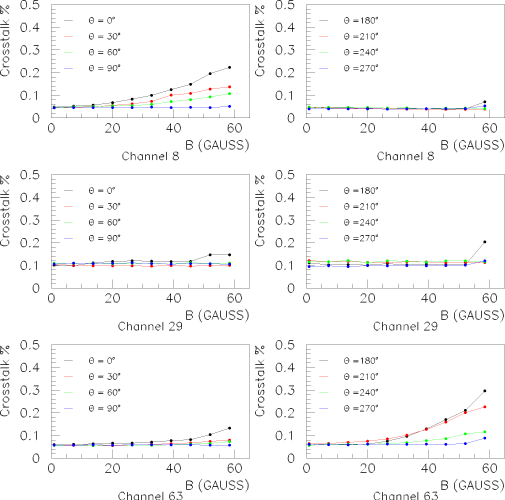
For this measurement, 3 channels have been chosen, one located on
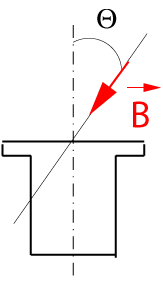
the center (channel #29) and two on the border (channels #8 and
#63). The crosstalk has been studied by illuminating each time
only on channel and by varying the direction and the intensity of
the magnetic field (Fig. 81).
The border channels are again the most affected whereas the
central ones remain stable (Fig. 82). It
appears again that the perpendicular direction is the most
dangerous. The effects on channels 8 and 63 are interchanged when
the field direction is reverted.
1.4.5 Magnetic shielding measurements
In this part, most of the simulated configurations have been tested for two
materials Mu-metal and ARMCO steel.
The setup for the test is the same used previously and the same quantities
have been measured. The considered configurations were the following:
-
"small" and "large" shielding with Mu-metal and ARMCO for several thickness,
-
"large" shielding with the reference bar supporting the cookies made in ARMCO,
-
two ARMCO sheets.
All the shielding configurations were tested with a field
perpendicular to the photocathode. The results of the
measurements are shown in Fig 83a) and
83b). Border channels suffer
significantly more than central ones. Large shielding, as
expected, is more appropriate for reducing the edge effects. The
collection efficiency varies strongly and the gain fairly with
the intensity of the magnetic field.
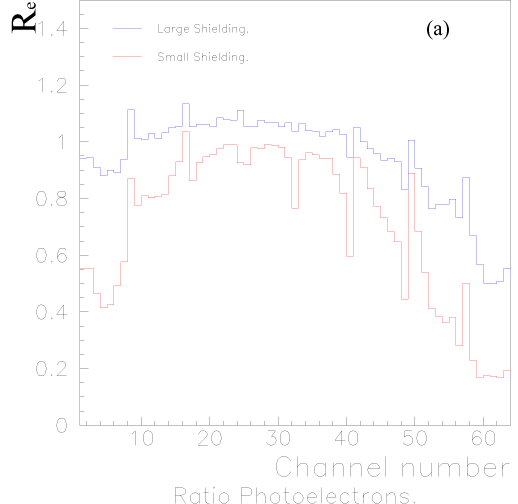
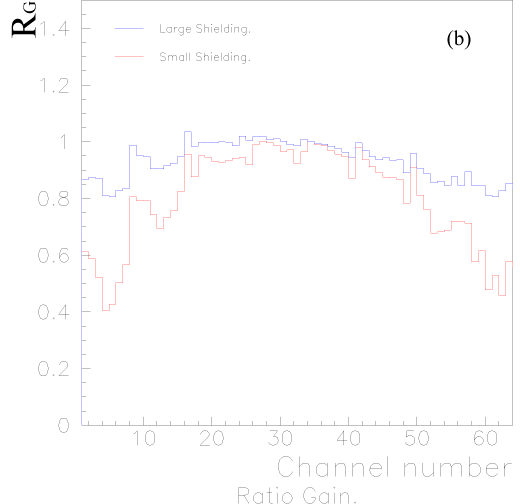 Figure 83: Measurements of
collection efficiency Re and
Gain RG ratios in a 60 Gauss field perpendicular to the
photocathode.
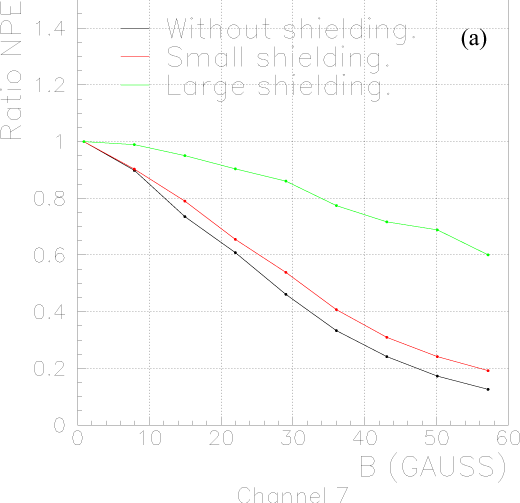
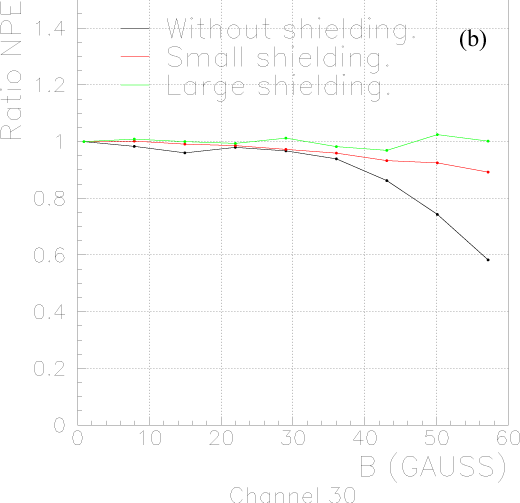
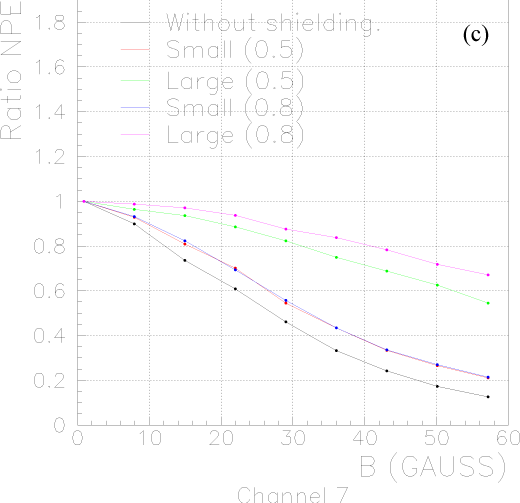
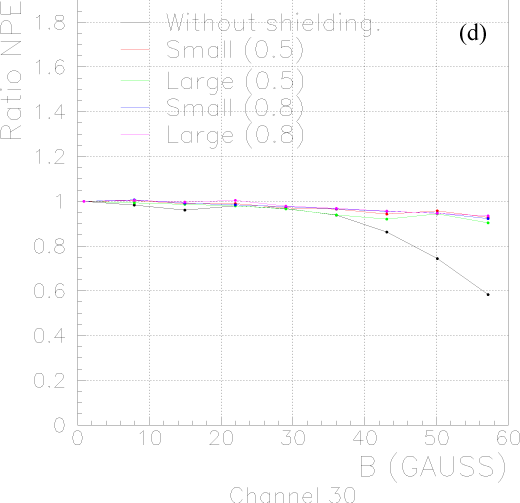
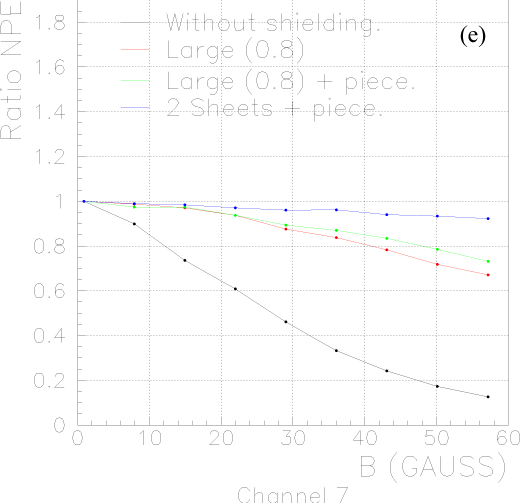
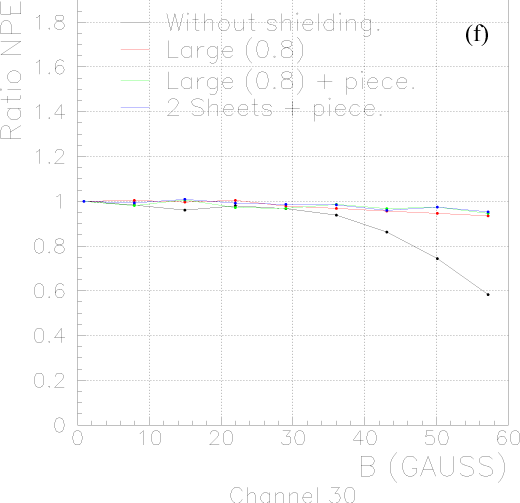 Figure 84: Evolution of the collection efficiency for several
configurations.
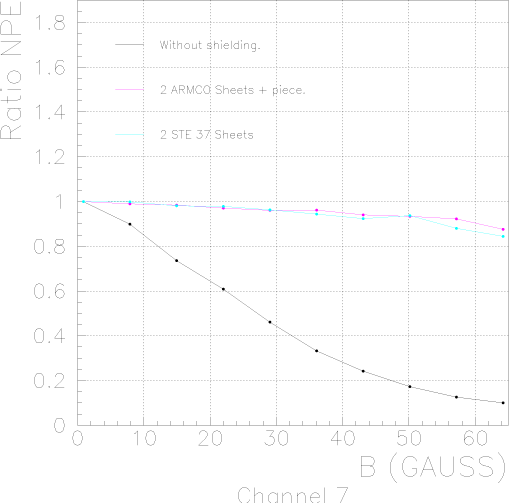
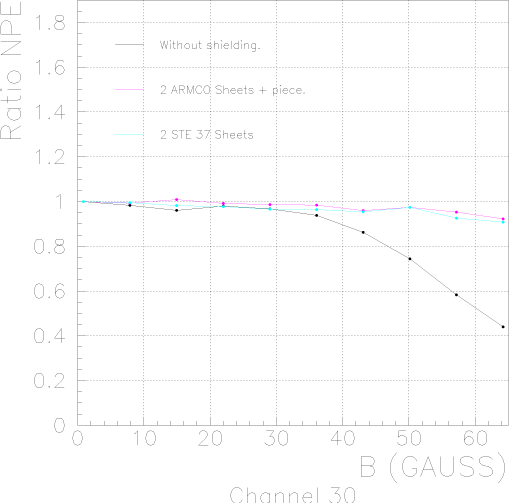 Figure 85: Collection efficiency variation for ARMCO and STE 37 steel
(channel 7,
channel 30).
The first tested configuration consists of a shielding material
made of Mu-metal. Its main features are high permeability and low
saturation field (Bs=0.8 T). The measurements shown by
Fig 84a) and
84b) with 0.3 mm thickness belts
indicates that the two configurations, large and small shieldings
are not sufficient for border channels. For the other channels
the ratio distribution appears flat with the magnetic field
variation.
The second tested configuration was consisting of replacing
Mu-metal by ARMCO steel (99.5% Fe, less expensive than Mu-metal)
whose permeability is lower but with higher saturation value
(Bs=2.15 T). Two thickness have been used, 0.5 mm and 0.8 mm
(due to availability problems the same thickness than Mu-metal
has not been used). The measurements shown by
Fig. 84c) and
84d) give a slight improvement for
0.8 mm thickness compared to Mu-metal.
A last configuration trying to reduce the edge effects has been
used. In this case, a special reference bar (cookie support) made
by ARMCO and two sheets simulating the surrounding end-caps
sheets possibly also made by ARMCO have been used. The
measurements shown by Fig. 84e) and
Fig. 84f) reveals that the two sheets
shielding configuration is the best inducing a relatively uniform
and low magnetic field intensity for all the channels. The
collection efficiency ratio is higher than 0.9 for all the PMT
channels. Finally, this last configuration has been adopted. For
the end-caps, ARMCO steel has been replaced by the less cost
effective and similar soft steel STE 37 giving similar results
(Fig. 85).
1.5 Construction
In order to finish the construction of the Target Tracker in time,
two production lines will be used. At least 6 modules per week
have to be constructed, tested and calibrated.
The construction of the modules is done according to the following
steps (table 7 summarizes the dimensions of the
main module elements):
Table 7: Dimensions of the main components of the Target
Tracker modules.
|
| Item | Dimension (mm) |
|
| Length of Al sheets | 6858+6-0 |
| Width of Al sheets | 1680+3-0 |
| Thickness of Al sheets | 0.6 |
| Diameter of Al sheet holes | 10 |
| Length of scintillator strips | 6860+0-2 |
| Thickness of scintillator strips | 10.6±0.1 |
| Width of scintillator strips | 26.3±0.1 |
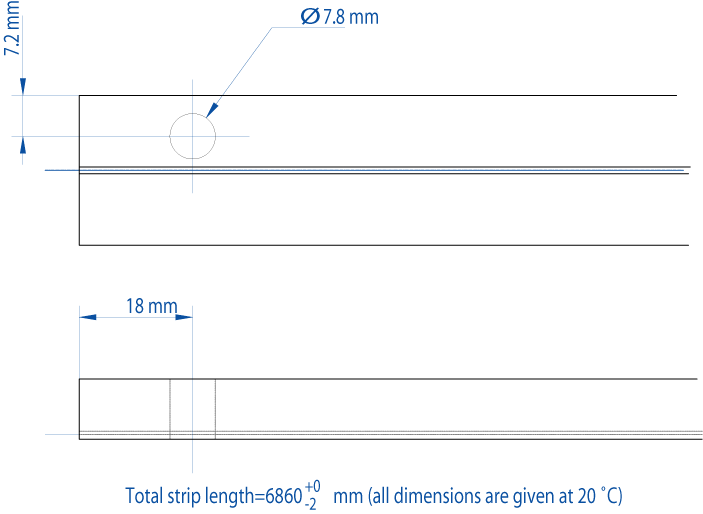
| Diameter of scintillator strip holes | 7.8 |
| Full module length | 7570.4±1 |
| Full module width | 1689.6±0.5 |
| Full module thickness at strips level | 13.6+0.3-0 |
| Full module thickness at end-caps level | 32.8+0.2-0 |
| Thickness of the double face adhesive | 0.9 |
|
-
The double face adhesive is glued on the two aluminium
sheets of the module. For attaching the two aluminium sheets on
the end-caps, 32 holes are drilled on each side of the
sheets (Fig. 6).
-
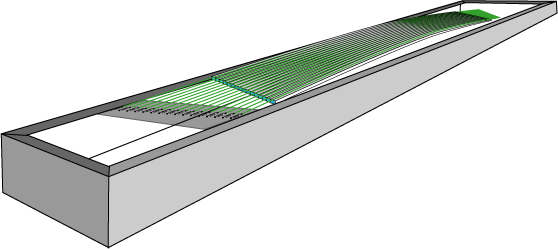
The WLS fibres are glued in the strip grooves. The
scintillator strips are placed on frames of 16 strips each
(Fig. 86) and the WLS fibres are placed on the
strips next to the grooves. The fibres are stretched using small
springs at one end and the strips are bent to have a circular
shape in order that the fibres will remain at the bottom part of
the grooves when they will be inserted in them. To
avoid fibre waste, the fibres are cut according to their
position in the module. Table 8 give the fibre
length according to the strip number. The frames are placed on a
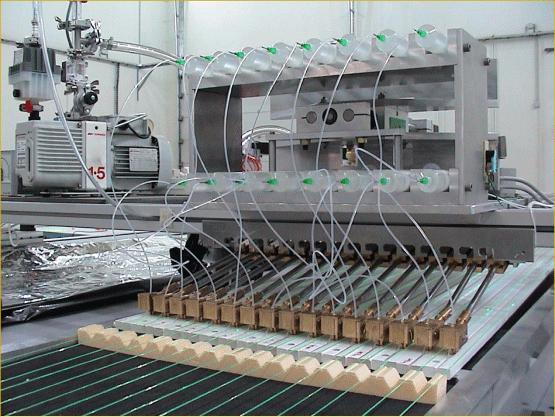
table equipped with a glue distribution system. The glue and the
hardener are mixed and
injected in each strip groove using 16 syringes (Fig. 87). After placing the
right glue quantity ( ~ 15 g/strip), the fibres are pushed
inside the grooves. At the end of the glue polymerization,
aluminized mylar band are glued all along the strip groove
length. This band, 10 mm wide, is only glued on both sides of the grooves but not on top of
them to keep an air gap and increase the light reflectivity of
the glue surface just above the WLS fibre.
Table 8: Fibre length according to the strip number.
|
| Strip number | Fibre length (mm) |
|
| 1,2 | 63,64 | 9004 |
| 3,4 | 61,62 | 8891 |
| 5,6 | 59,60 | 8778 |
| 7,8 | 57,58 | 8665 |
| 9,10 | 55,56 | 8552 |
| 11,12 | 53,54 | 8439 |
| 13,14 | 51,52 | 8326 |
| 15,16 | 49,50 | 8213 |
| 17,18 | 47,48 | 8100 |
| 19,20 | 45,46 | 7987 |
| 21,22 | 43,44 | 7874 |
| 23,24 | 41,42 | 7761 |
| 25,26 | 39,40 | 7648 |
| 27,28 | 37,38 | 7535 |
| 29,30 | 35,36 | 7422 |
| 31,32 | 33,34 | 7309 |
|
-
The two end-caps of the module are placed on the assembly
table (two tables will be used for the production of the 496
Target Tracker modules). This table can be rotated in order to
be able to put the modules vertically along their length to
facilitate their handling. The end-caps are well aligned with
the help of reference pins fixed on the table. After that, bottom
aluminum sheet is placed and aligned on the table. The aluminum
sheet is glued on the end-caps using a black glue in order to
avoid light leakages.
-
The double face adhesive protection is removed. Thick
strings are transversally placed on the double face adhesive
every 40 cm to avoid, in a first stage, the scintillator strips
to touch and glue on the adhesive. The strips are placed in the
module on top of the strings one by one. In one side they are
fixed by the end-caps rivets, while on the other side they are
free (even number strips are fixed on one side and odd on the
other side). The two fibre ends are inserted in the cookies'
holes.
-
Before the strings are pooled out to allow the strips to
be glued on the double face adhesive of the bottom aluminium
sheet, all module dimensions are verified, the position of all
strips are checked and rectified if needed. If damaged fibres
are observed, the concerned strips are removed (they are not yet
glued) and replaced by new ones.
-
The strings are removed and the strips are glued on the
double face adhesive. The top aluminium sheet is placed and is
pressed against the strips.
-
The two light injection systems are placed in the end-caps.
-
Black glue is injected in the small tank of the cookies. The holes of the cookie are by 0.08 mm
larger than the fibre diameter for the glue to fill
the holes and come slightly out of them.
-
The end-caps coverage is sealed using black glue. Strong
aluminium ribbon reinforced with carbon fibres is glued on the
two long edges of the module to protect the two outside strips
and provide light tightness to the module.
-
When the cookie glue has polymerized, the modules are
placed in vertical position in a vacuum box. This vacuum box has
on its two long sides two elastic membranes well compressing the
two large module surfaces when vacuum is performed. The pressure
is only applied on the surface of the two aluminium sheets and
not on the end-caps which are well protected.
-
The two cookies faces are polished with a diamond head
machine.
For the production of the 496 modules and the 8 spares, four
people will be employed per assembly table. Three other people
will take care of the fibre gluing in the scintillator strip
grooves. The construction of all the modules will last about 20
months.
1.6 Module tests and calibration
When the module assembly is finished, the PMT's and the
front-end electronic boards are placed in the two end-caps. The
light tightness of the modules is tested using PMT's dynode 12
which is the OR of all the PMT channels (an auxiliary high
voltage module is used).
The DAQ boards are installed in the end-caps and connected to
the front-end boards. The LED's are also installed (2 per
end-cap) and pulsed in order to test the whole acquisition
system, the LED pulsers and the PMT high voltage modules placed
on the DAQ cards.
At this stage the module is ready for calibration. It is placed
on a vertical scanning table equipped with two electron
spectrometers able to irradiate any point of the module.
The high voltage value determined during the PMT tests is applied
on both PMT's of the module. The correction factors equalizing
all the PMT channels are set in the front-end chips.
The scanning table is driven by the acquisition program. In order
to calibrate 2 modules per table and per day, 9 measured points
are performed per strip uniformly distributed on all the strip
length. Each one of the two spectrometers independently
irradiates 32 strips. Using the signal of the trigger PMT's of
each spectrometer one can know which strip has been irradiated.
Two scanning tables will be used during the whole module
production period.
All the scintillator modules will be calibrated in their
construction place. In the Gran Sasso underground laboratory,
only the time evolution of the scintillator strips has to be
followed and compared to the initial reference "point".
Irradiating the scintillator strips using a radioactive source
after they have been mounted in the detector necessitates extra
mechanical systems and, more difficult, space and complicated
operations. An extra difficulty comes from the fact that the
emulsion bricks in the vicinity must not be irradiated. Use of
cosmic rays or rock muons is not practical due to the expected
low statistics and complicated charge distributions and
normalizations. Natural radioactivity could help to cross-check
light variation observed by dedicated measurements ([22].
A simple and cheap system to follow the scintillator strips and
glue (used for fibre gluing) ageing is what we will call in the
following the "Domino Monitoring System" (DMS): From one over
four scintillator strips, during construction, a piece of 46.5 mm
is cut (taken into account during the strip production). 144
optically isolated pieces glued together form a strip of the same
length than a normal scintillator strip. The 7936 pieces can be
mounted in an extra scintillator module.
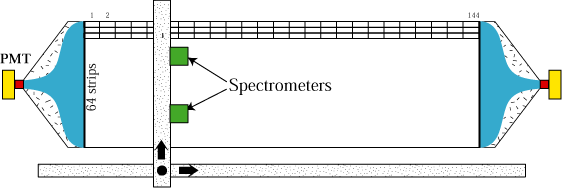 Figure 88: Domino Monitoring System (DMS).
This module can be placed on one of the scanning tables
(Fig. 88) each piece can be irradiated by an electron
spectrometer equipped with a trigger. An x-y displacement can
be used to irradiate all the scintillator strip pieces. For a
rate of 50 Hz, 10000 triggers and 30 s displacement per piece, 25
scanning days are needed to irradiate all the pieces using one
spectrometer.
A prototype strip of 144 pieces of 46 mm length each, has been
constructed. The pieces have been glued together in a metallic
guide forming thus a strip of 6.7 m length. The fibre glued on
the pieces grooves was a Kuraray Y11 (175) MJ non-S with a
diameter of 1.0 mm. Fig. 89 presents the number of
p.e detected on each fibre side as a function of the piece
position (one point per piece) after a piece irradiation using
the electron spectrometer. The number of p.e detected for pieces
at 4.3 m (middle of the strip) exceeds 4 and it's at least by
0.5 p.e higher than for normal strips where the same scintillator
has been used. This is due to the limited light path due to
reflections on the lateral faces of each piece. In order to
estimate the required positioning accuracy of the spectrometer, a
fine scan with a step of 1 mm has been performed between the
middle of one piece up to the middle of the next piece (for
pieces at a distance of about 5.5 m, see Fig. 89).
Fig. 90 presents the obtained result. Between
two pieces there is a loss of about 12% but there is a
comfortable "plateau" over a distance of 2×15 mm around
the middle of each piece. Thus, the spectrometer position
accuracy must be less than 1.5 cm, accuracy which can easily be
achieved.
The DMS system can be installed in the Gran Sasso underground
laboratory or in one of the participating institutes. It will
permanently be operated over the hole data taking period.
1.7 Radioactivity in Target Tracker
In this section the radioactivity measurements of the materials used for the
Target Tracker construction are presented. Using the results of these
measurements, a simulation to obtain an estimation of the induced background
in the scintillator strips and measured by the WLS fibres and the PMT's, has
been prepared.
1.7.1 Radioactivity measurements
Gamma-ray spectroscopic measurements with a germanium detector have been
performed. This method allows to distinguish many radio-isotopes during one
measurement without destruction or chemical change of the sample. Significant
improvements were realized these last 10 years on the sensitivity of
g-spectroscopy due to development of ultra-low background cryostats,
availability of large Ge crystals and use of efficient shielding in
underground laboratories.
Experimental setup:
In order to reduce the background due to cosmic-rays, the detector was
installed underground at the "La Vue-des-Alpes" laboratory [23],
located in the Swiss Jura mountains (600 m water-equivalent). The detector is
equipped with a 400 cm3 ultra low background spectrometer. The Ge crystal
is coaxial and of "p-type" allowing to minimize the effect of the
210Pb inner surface contamination of the end-cap, it is cooled with
nitrogen. It has however the disadvantage to lower the g-efficiency at
low energy.
The detector was shielded with 15 cm of very pure OFHC copper and 20 cm of low
activity lead. In addition, this passive shielding was enclosed in tight
aluminium box pressurized with nitrogen in order to keep the radon out of the
detection cell (Fig. 91). The materials used for cryostats were
selected or specially developed for their low level or absence of
radioactivity. In particular the pipe and the cover were made from very pure
Al(4%)Si alloy. The activity of this alloy is known to be less than 0.3 ppt
on U and Th.
The background spectrum measured during 28 days is presented in figure
92. The observed g-lines are from natural radio-isotopes,
essentially 214Pb and 214Bi from the 238U family, 208Tl
and 212Pb from the 232Th series and 40K, or from 137Cs, a
fission product isotope mainly formed during atmospheric bomb tests and the
Tchernobyl nuclear accident. The e+e- annihilation line at 511 keV is
essentially due to the presence of residual cosmic muons and neutrons in the
laboratory.
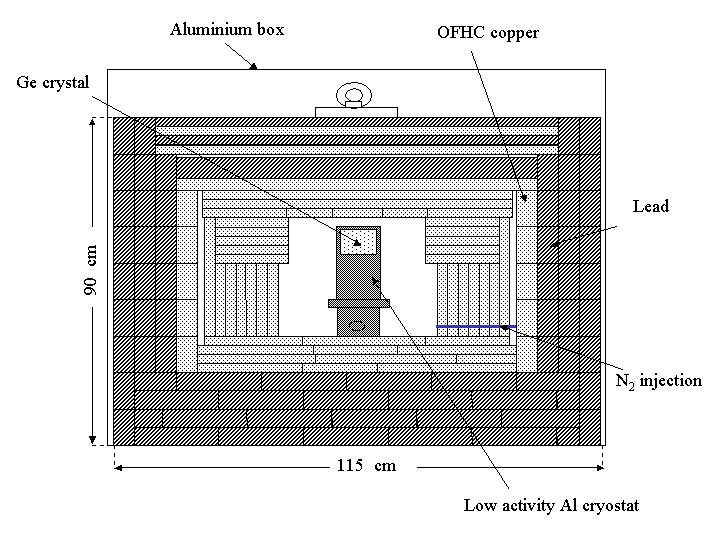 Figure 91: Drawing of the shielding and the detector installed in the Vue
des Alpes laboratory.
1.7.2 Determination of the abundance of radio-isotopes
For most materials the principal contaminants are the primordial nuclides K,
Th and U. The latter two have complex decay chains whose equilibrium can be
disturbed by chemical reactions during material processing as well as in
geological processes. In the natural case, when secular equilibrium is
assured, all members yield the same decay rate (normalized to their respective
branching ratios). Since only few elements of both series are accessible to
gamma spectroscopy at reasonable rates, disequilibrium is not observable in
all cases by that method. However, the time scales for reestablishing the
equilibrium are so long compared to the normal experiment running times that
the information by gamma emitting members are mostly sufficient for background
consideration. We will assume that the Th serie is in equilibrium as the half
lives of each emitters are close. About the U serie, we have to consider two
parts. The first start from the 238U to the 230Th which contains
only two gamma emitters, 234Th at 63 and 93 keV which is difficult to
see because of the low energy and a small intensity, and the 234mPa at
1001 keV also difficult to see because of its low intensity. The second
contains all the remaining part of the serie, which the elements are in
equilibrium due to their close half lives. If only gammas from the second part
is measured, we will assume that the first part is in equilibrium with the
second one.
As usual, the abundance of the observed isotopes was determined by the
strength of characteristic gamma-lines. 40K and 137Cs are
identified by their well-known g-lines (1461 and 662 keV respectively).
In the 238U series, the g-emitters are essentially 234Th (63
and 93 keV), 234mPa (1001 keV), 214Pb (295 and 352 keV) and
214Bi (609 keV). In the 232Th series the measured radio-isotopes are
228Ac (338 and 911 keV), 212Pb (238 keV) and 208Tl (583 and
2614 keV). A detailed look at the two decay chains shows that the present
experimental conditions allow us to determine:
-
activity of 238U (same as 234mPa and/or 234Th) and 226Ra (in equilibrium with 214Pb and
214Bi),
-
activity of 228Ra equal to that of 228Ac and 228Th ( with 208Tl and 212Pb
decays).
One must notice that 232Th, head of the Th series, is not measurable in the present experimental conditions.
The activity act of radio-isotopes was calculated as follows:
where S is the total number of counts in the peak of interest, t
the time of measurement, e the Ge detection efficiency, I the
intensity of the g-line and W the sample mass.
Detection efficiencies of spectrometer were calculated with the
GEANT3 Monte-Carlo code. Typical efficiency of Ge detectors at 1
MeV is 5%. The sensitivity of measurements for a given
radio-isotope achievable with the involved spectrometer depends
essentially on the volume of the Ge, the weight of samples and
time of measurement and, last but not least, the activities of
other isotopes in the sample itself which can complicate the
analysis of the spectrum. As an example, limits in 238U
activity are determined by using counting rate in the 93 keV line
of 234Th or the 1001 keV line of 234mPa if the low
energy region becomes too complex. Due to different branching
ratios and efficiencies of detection of the two g-lines,
the calculated limit can be markedly distinct.
For the Target Tracker different materials have been chosen for the final
construction using different criteria. For instance the scintillator strips
have been chosen for the quality of the light yield, the glue for the fibres
for its good quality of light transportation.... The goal of this
radioactivity measurements is to ensure that the activity of the selected
materials is rather low and will not give too much background rate in the
scintillator strips.
More than 20 materials have been measured, during around one week each. The
complete results are summarized in table 9 (scintillator strip,
TiO2 powder, glues for optical fibre), table 10 (double face
scotch and glue for the cover) and table 11 (aluminium cover, foam
and iron for the end-caps). The components chosen for the final construction
have been put in bold characters in these tables. Figure 93 shows the
Chemo Technique (one of the candidate companies for strip production)
co-extruded scintillator strip spectrum obtained after 165 hours of
measurement, the peaks of 214Bi and 214Pb from the 238U serie
are clearly visible.
Table 9: Results of the radioactivity measurement of scintillator
plastics, optical fibre and glues for optical fibre.
| |
| Materials | Activity (Bq/g)
|
| |
| | | |
| 238U series | 232Th series | |
| | | |
| | | | | |
| 238U | 226Ra | 228Ra | 137Cs or 60Co | 40K |
| | | | | |
| Amcrys | | | | 137Cs | |
| scintillator | equil. | (1.76±0.21).10-5 | | (3.78±1.33).10-6 | |
| (co-extrusion) | | | | | |
| Chemotech. | | | | 137Cs | |
| scintillator | equil. | (4.88±1.72).10-6 | | (2.80±0.93).10-6 | |
| (simple extrusion) | | | | | |
| Chemotech. | | | | | |
| scintillator | equil. | (1.72±0.05).10-4 | | | (2.53±1.64).10-5 |
| (co-extrusion) | | | | | |
| PolyHiTech. | | | | | |
| scintillator | equil. | (1.31±0.21).10-5 | | | |
| (co-extrusion) | | | | | |
|
| | | | 137Cs | |
| optical fibre | equil. | (4.00±0.63).10-4 | (4.12±1.15).10-4 | (6.57±2.46).10-5 | (1.16±0.50).10-3 |
| (Kuraray Y11) | | | | | |
|
| | | | | |
| glue 815 C | equil. | (3.89±0.78).10-4 | | | (3.15±3.16).10-4 |
| ( sample 4.8 g) | | | | | |
| | | | | |
| hardener 815 C | equil. | (1.94±0.27).10-4 | | | |
| | | | | |
| | | | | |
| glue 301 | equil. | (1.26±0.05).10-3 | | | (2.66±1.46).10-4 |
| | | | | |
| | | | 137Cs | |
| hardener 301 | | | (1.58±0.4).10-4 | (2.47±1.1).10-5 | (3.99±1.82).10-4 |
| | | | | |
|
| | | | 137Cs | |
| TiO2 (R104) | | | (1.68±0.65).10-5 | (5.90±2.62).10-6 | |
| | | | | |
| | | | | |
| TiO2 (R960) | (2.82±0.24).10-4 | (2.04±0.93).10-4 | equil. | | (4.26±1.78).10-4
|
| | | | | |
| | | | | |
| TiO2 (706) | equil. | (5.42±0.32).10-4 | (1.17±0.45).10-4 | | (3.64±1.58).10-4 |
| | | | | |
Table 10: Results of the radioactivity measurement of the double face
adhesive and glues for the cover.
| |
| Materials | Activity (Bq/g)
|
| |
| | | |
| 238U series | 232Th series | |
| | | |
| | | | | |
| 238U | 226Ra | 228Ra | 137Cs or 60Co | 40K |
| | | | | |
| | | | 137Cs | |
| FM 422 | equil. | (7.25±0.40).10-4 | (4.73±2.05).10-5 | (9.84±4.10).10-6 | (4.19±6.26).10-5 |
| | | | | |
| | | | 60Co | |
| M 2755 | equil. | (1.57±0.26).10-4 | (3.69±2.19).10-5 | (2.27±2.01).10-6
| (9.96±9.24).10-5 |
| | | | | |
| | | | | |
| FM 477 | equil. | (1.59±0.26).10-4 | (3.34±3.17).10-5 | | (2.74±0.61).10-4 |
| | | | | |
| | | | | |
| M 2708 | equil. | (1.30±0.26).10-4 | (1.90±0.56).10-4 | | |
| | | | | |
|
| | | | | |
| TERO | (3.11±0.65).10-4 | (2.40±0.01).10-3
| (3.34±0.04).10-4 | | (2.93±0.49).10-5 |
| 935 | | | | | |
| | | | | |
| sikaflex | (5.35±0.44).10-5
| (2.35±0.02).10-3 | (1.59±0.31).10-5 | | (1.16±0.07).10-4 |
| 221 | | | | | |
Table 11: Results of the radioactivity measurement of the aluminium
cover, foam and iron for the end-cap and glass fibre.
| |
| Materials | Activity (Bq/g)
|
| |
| | | |
| 238U series | 232Th series | |
| | | |
| | | | | |
| 238U | 226Ra | 228Ra | 137Cs or 60Co | 40K |
| | | | | |
| | | | | |
| alum. | (5.47±0.71).10-3 | (1.45±0.36).10-5 |
(4.59±0.18).10-4 | | (6.12±3.44).10-5
|
| cover | | | | | |
| | | | | |
| foam | equil. | (4.44±1.49).10-5 | (1.90±0.97).10-5 | | (8.40±0.17).10-3 |
| end-cap | | | | | |
| | | | 137Cs | |
| iron | equil. | (6.64±0.69).10-6 |
(3.33±0.90).10-6 | (1.19±0.56).10-6
| (1.88±0.53).10-5 |
| end-cap | | | | | |
| | | | | |
| glass fibre | equil. | (1.88±0.01).10-1 | (1.27±0.01).10-1 | | (4.66±0.03).10-1 |
| | | | | |
1.7.4 Background estimation in the Target Tracker resulting from the
radioactivity
In this section the results of the previous radioactivity
measurements are used to estimate the signal induced signal in a
scintillator strip. For this, all the particles (a,
b, g) coming from the decay chain of the radioactive
atoms are simulated for each component (optical fibre, glue,
scintillator strip, double face adhesive, aluminium cover). Then
we propagate these produced particles in the Target Tracker
geometry and simulate the energy they deposit in the
scintillator strip.
Simulation design:
Geometry:
Fig. 94 shows the geometry used for the simulation. 3
scintillator strips have been considered in order to estimate the
signal produced in the middle one. The dimensions of the strips
are 2.6×1 ×700 cm3, the thickness of the double
face adhesive is 0.9 mm, the one of the aluminium sheet 1 mm and
the diameter of the fibre is 1 mm. The groove depth is 2 mm and
its width 1.6 mm. It is filled with the fibre and the optical
glue. Table 12 gives the activity of each
component for each radioactive decay chain, corresponding to this
geometry.
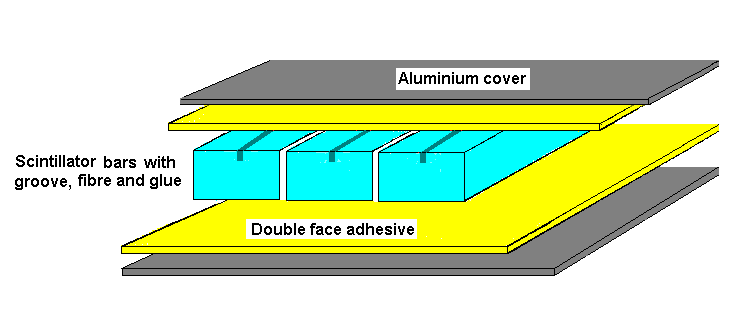 Figure 94: Drawing of the geometry used for the simulation.
Principle of the simulation:
For each component we know its radioactivity elements content,
hence we can take randomly from each decay serie (e.g. the
238U serie, the 232Th serie, the 137Cs,
60Co and 40K) one radioactive atom at a random
position inside the component and simulate its decay chain
products (a, b, g). Sometimes several
particles arise from the same decay chain and they have to be
considered together in one event. This generation is repeated
106 times to reproduced correctly each decay serie and to
have enough statistics. The produced particles are propagated
through the geometry and their position and energy are recorded
when they cross the central scintillator strip. For the central
strip itself, the same information is recorded but inside its own
volume. Finally, for each component and for each decay serie the
deposited energy of each particle at the corresponding position
on the central strip is evaluated. Figure 95 shows the
deposited energy spectrum for the 40K from the aluminium
cover.
Signal estimation:
Knowing the position on the scintillator strip where the
particles deposit their energy, the attenuation in the fibre has
been taken into account to estimate the number of p.e finally
measured by the PMT. For the fibre attenuation, the
parameterization given in table 8 for the fibre
KURARAY Y11(175) has been used. The total length of the fibre is
considered to be 8.6 m and it is assumed that 5 p.e. are
observed on the average at 4.3 m from the PMT.
To estimate the signal recorded by the PMT's, it is considered
that, on average, a deposited energy of 400 keV corresponds to a
signal of 1 p.e. to be shared between both ends of the fibre
according to the event position. In this estimation it is assumed
that the deposited energy in the scintillator strip is totaly
transmitted to the fibre. This is an over estimation and will
give an upper limit for the radioactivity background rate.
Finally, only cases where at least 0.75 p.e are observed on each
side of the fibre are considered.
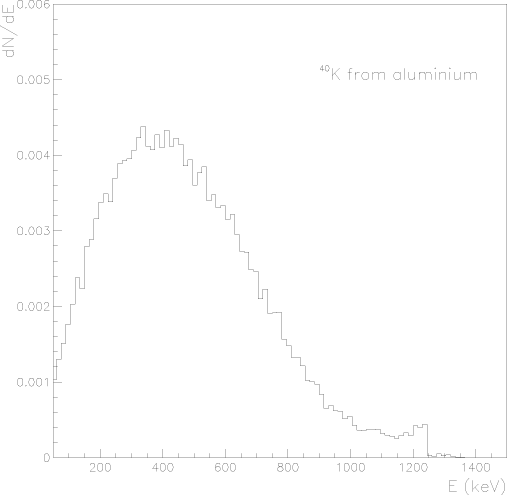 Figure 95: Deposited energy spectrum in the central strip
for the events coming from the 40K in both layers of the
aluminium cover. This spectrum is normalized according to the
40K rate in the aluminium cover (see table 12).
Results:
For each components and each decay serie 106 radioactive
decays have been simulated from which the number of events
satisfying the cuts (at least 0.75 p.e detected at each fibre
end) has been extracted. Finally this number is normalized
according to the activity of each components (see table
12). The central scintillator strip has been
treated separately because its contribution should be greater
than the one of the side strips and the normalization have to be
done separately. As an example, Fig. 96 shows the
PMT pulse height distributions (in units of p.e.) induced by the
238U decay chain of the aluminium covers for events
satisfying or not the above cuts.
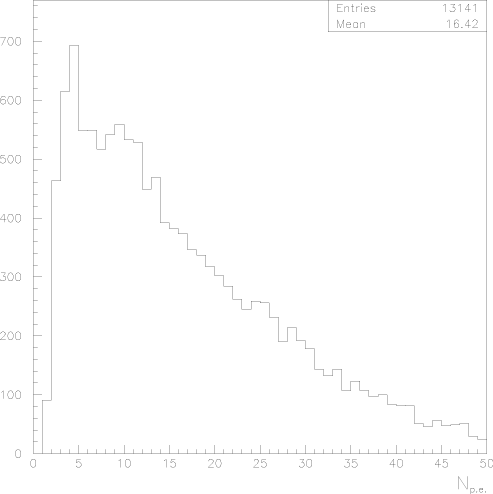
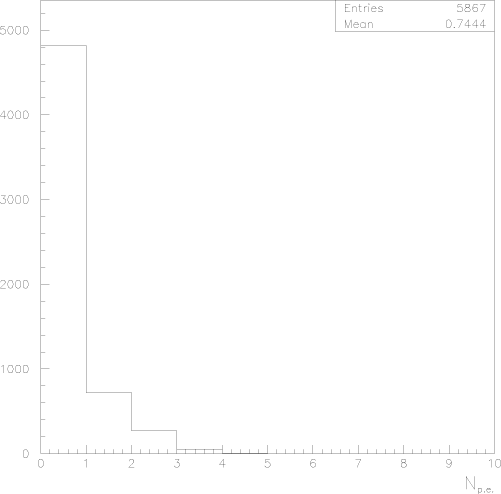 Figure 96: Photoelectron distributions for events, above the
cuts (left) and below the cuts (right), coming from the 238U
decay chain of the aluminium covers.
Table 13 gives the signal rate estimation induced by the
radioactivity of each component and the total signal rate. The
quoted error only reflects the uncertainty on the radioactivity
measurement. As it can be seen, the main contribution is given by
the aluminium cover which gives a total rate of 0.24 s-1.
One can also observe that the contribution of the glue and the
fibre can be neglected.
To study the fluctuations of this estimation, the production
threshold of one p.e has been put at 300 keV. An increase of
around 3% is observed for the total rate. If a threshold of 0.75
p.e is applied on only one side, the rate increases by about 7%.
The total background rate per scintillator strip induced by the
radioactivity of all components is estimated to 0.3 ±0.1
s-1, where the enlarged error includes the uncertainty on
the triggering level.
Table 12: Radioactivity rate estimation of each component used for the
Target Tracker construction and corresponding to the geometry used in this
simulation.
| Materials | Decay serie | Activity× mass [Bq] |
| (mass ) | | |
| Double face | | |
| (2 layers of 150 g = 300 g) | | |
| 238U | (4.71±0.78).10-2 |
| 232Th | (1.11±0.66).10-2 |
| 60Co | (6.81±6.03).10-4 |
| 40K | (2.98±2.77).10-2
|
| Central Scintillator strip | | |
| (1 strip of 2800 g ) | | |
| 238U | (0.49±0.06).10-1 |
| 137Cs | (1.06±0.37).10-2 |
| Side Scintillator strips | | |
| (2 strips of 2800 g = 5600 g) | | |
| 238U | (0.99±0.12).10-1 |
| 137Cs | (2.12±0.75).10-2 |
| Aluminium | | |
| (2 layers of 1475 g =
2950 g) | | |
| 238U | 16.1±2.1 |
| 228Th | 1.35±0.05 |
| 226Ra | (0.43±0.11).10-1 |
| 40K | 0.18±0.10 |
| Fibre in the central strip | | |
| (1 fibre of 5 g) | | |
| 238U | (2.00±0.32).10-3 |
| 228Th
| (2.06±0.58).10-3 |
| 137Cs | (3.26±1.23).10-4 |
| 40K | (0.58±0.25).10-2
|
| Fibres in the side strips | | |
| (2 fibres of 5 g = 10 g) | | |
| 238U | (4.00±0.64).10-3 |
| 228Th
| (4.12±1.16).10-3 |
| 137Cs | (6.52±2.46).10-4 |
| 40K | (1.16±0.50).10-2
|
| Glue in the central strip | | |
| (1 groove filled with 7 g) | | |
| 238U | (2.72±0.55).10-3 |
| 40K | (2.21±2.21).10-3 |
| Glue in the side strips | | |
| (2 grooves filled with 7 g = 14 g) | | |
| 238U
| (5.44±1.10).10-3 |
| 40K | (4.42±4.42).10-3 |
Table 13: Signal rate estimation induced by each component.
| Materials | Decay serie | Rate (s-1) | Total rate (s-1) |
| | | |
| Aluminium | | | |
| 238U | 0.212±0.028 | |
| 232Th | 0.017±0.001 | |
| 226Ra | 0.006±0.0001 | |
| 40K | 0.005±0.003 | 0.240
±0.032 |
| Central Scintillator strip | | | |
| 238U | 0.039±0.005 | |
| 137Cs | 0.008±0.003 | 0.047 ±0.008 |
| Double face | | | |
| 238U | 0.002±0.0003 | |
| 232Th | 0.0004± 0.0002 | |
| 60Co | 0.0001±0.0001 | |
| 40K | 0.004±0.004 | 0.0065
±0.0046 |
| Side Scintillator strips | | | |
| 238U | 0.0006±0.0001 | |
| 137Cs | 0.0004±0.0001 | 0.001 ±0.0002 |
| Fibre in the central strip | | | |
| | negligible | |
| Fibres in the side strips | | | |
| | negligible | |
| Glue in the central strip | | | |
| | negligible | |
| Glue in the side strips | | | |
| | negligible | |
|
| | |
| TOTAL RATE
(s-1) | 0.294 ±0.045 |
| | |
The glues used for the module construction are already well known
and have been used by other High Energy experiments
(NEMO[24], MINOS) experiment. Several glue samples have
been followed for more than 7 years.
The strength of the double face adhesive is guaranteed by the
production and selling companies (MACTAC8 and
VARITAPE9) not to vary for at least 10 years.
For scintillator strip ageing, according to AMCRYS-H tests, a 10%
light decrease is expected over 10 years which is acceptable for
our application.
Kuraray fibres are already widely used or tested by high energy
experiments in more severe conditions than the OPERA ones
(ATLAS[25]) and no ageing effects have been reported.
No ageing is expected for multianode PMT's.
1.9 Installation
The modules are sent to the Gran Sasso underground laboratory in
boxes of 4 modules. The boxes are equipped with an antishock
system to avoid breaking WLS fibres. They are also used for module handling
during the Target Tracker wall construction.
To allow the Target Tracker wall preparation to go in parallel
with the brick wall installation, the Target Tracker walls will be
mounted outside the detector, tested and inserted between the
brick walls at a later stage. A wall mounting mechanical structure
will be constructed in front of the OPERA detector as
schematically shown by Fig. 97. It is composed by a
platform (Fig. 98, and 99)
where the walls are mounted and a portico where they are stored.
The platform is designed to support a wall (1600 kg) and 5 people
standing on it.
For the vertical modules the transportation box is put in vertical
position and the modules are extracted one by one and fixed
directly on a beam hanging on the platform. This beam will also be
used to hang the Target Tracker wall under the OPERA main I-beams
(Fig. 100). An aluminium flat beam connects also
the lower end-caps of the 4 vertical modules. When the 4 vertical
modules are hanged, the box containing the 4 horizontal modules is
put in horizontal position near the platform and the first
horizontal module is extracted and directly hanged from both
end-caps directly to the wall beam. The other 3 horizontal
modules are hanged on the first one and on one another.
The horizontal and vertical modules are maintained together with
"hooks" called croisillons as schematically shown by
Fig. 101. In this way, at least near the places
where the croisillons are placed, the distance between vertical
and horizontal modules is 1 mm corresponding to the thickness of
the stainless steel sheet used for the croisillon production.
When the wall is ready, the detector cabling can be done. A mobile
DAQ system can be used to check all the modules by pulsing the
light injection system. Another crucial point to be re-tested is
the light tightness before the Target Tracker walls are inserted
inside the OPERA detector.
After each wall preparation, the walls are suspended on the
portico just in front of the platform and fixed on the OPERA
detector structure. The portico can support up to 16 walls (about
30 tons) .
For the wall mounting and cabling 3 people are needed. They will
stay at Gran Sasso underground laboratory during 5 periods of one
month each to mount the 62 Target Tracker walls.
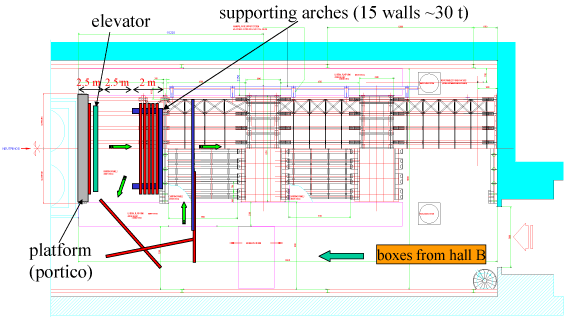 Figure 97: Target Tracker mounting procedure.
 Figure 98: Schematical view of Target Tracker pre-mounting
installation.
 Figure 99: Target Tracker pre-mounting installation.
The walls pending on the portico can be inserted and hanged inside
the OPERA detector using a "hook" (Fig. 102) as shown
by Fig. 1.3.7. The hook is handled by the hall C crane.
When the wall is under the OPERA main I-beams, they are hanged on
them through their beams and turnbuckles (Fig. 104).
The walls are also attached on the floor in order to constrain
them to stay straight and vertical. All the wall internal
adjustments having been done during the wall construction, only
global adjustments have to be done during this operation.
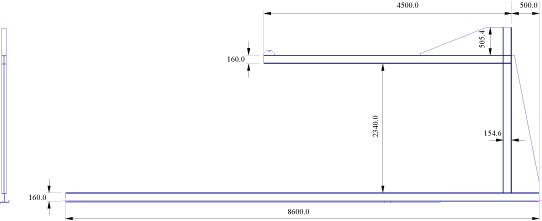 Figure 102: "Hook" used for the Target Tracker wall
insertion inside the OPERA detector.
The installation schedule of the Target Tracker is summarized by
table 105.
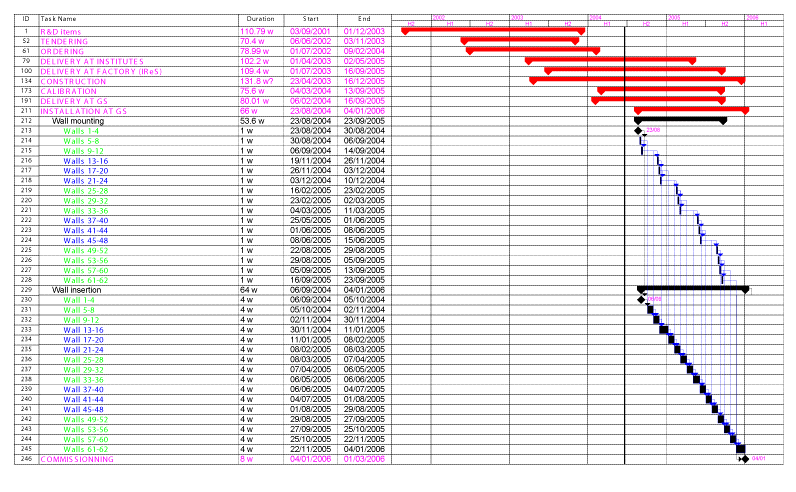 Figure 105: Target Tracker schedule.
References
-
OPERA proposal,"An appearance experiment to
search for nm « nt oscillations in the
CNGS beam", CERN/SPSC 2000-028, SPSC/P318, LNGS P25/2000, July
10, 2000.
-
E. Ables et al. (MINOS), Fermilab Proposal P-875 (1995).
-
Hamamatsu Photonics K.K., Electron Tube Center, 314-5,
Shimokanzo, Toyooka-village, Iwata-gun, Shizuoka-ken,
438-0193, Japan.
-
E.H. Bellamy and al., NIM A 339 (1994) 468-476.
-
M.Dracos et al., "Plastic sintillator target tracker proposal and studies done at Strasbourg", OPERA-NOTE 26, 16 June 2001.
-
CERN Finance Comittee, 290th meeting, 19 June 2002 CERN/FC/4583
-
R. Arnold, E. Baussan et al, IReS, "Results about H7546 Multianode PMT's studies", OPERA Internal Note #30,
-
Technology AutriaMicroSystems (AMS) BiCMOS 0.8 microns, see web site for documentation: "http://cmp.imag.fr/ManChap1-02.html"
-
"Performance of a FE electronics ASIC for the OPERA Target Tracker: Version-1", Opera Internal note #34
-
"Performance and Design of a Front End electronic ASIC for the OPERA Target Tracker: Version-2", Opera Internal note #40
-
"The OPERA ROC: a Read Out Chip for the OPERA Target Tracker", Opera Internal note #41
-
Software Cadence software, Design for manufacturing technology, see web site: "http://www/cadence.com"
-
Software Artist
-
C. de La Taille, G. Martin-Chassard, L. Raux, LAL Orsay, presentations
at OPERA Target Tracker meetings, CERN Jul-2001,
CERN October 10-2001, CERN Fevrier-2002 accessible on
http://www.lal.in2p3.fr/recherche/opera/internal_hard.html
-
F. Terranova, "Magnetic field map of the OPERA spectrometer", OPERA note #30.
-
OPERA-3d OPERA-2d and TOSCA are products by Vector Field Ltd., Oxford, UK (www.vectorfields.co.uk)
-
AMPERES, 3D Magnetostatic design software, Integrated
Engineering Software, 46-1313 Border Place, Winnipeg, Manitoba,
Canada R3H OX4 (www.integratedsoft.com).
-
G. Di Iorio et al. "Measurments of the Magnetic Field in the Prototype of
OPERA Spectrometer", OPERA note, LNF-01/028.
-
Y.Yoshizawa, H. Ohtsu, N.Ota, T. Wanatabe, J.Takeuchi, "The Developpement and
the study of R5900-00-M64 for scintillating/Optical Read Out", Hamamatsu
Photonics K.K., Electron Tube Center. 314-5, Shimokanzo, Toyooka village,
Iwata-gun, Shizuoka Pref., JAPAN.
-
Matthew A. Barker and Alfons Weber, "Effects of Magnetic Fields on Hamamatsu R5900-00-M64 PMT's"
NuMI-L-602.
-
E. Baussan et al. "Results about H7546 multianode PMT's studies", OPERA note #29.
-
J. Favier, "A possible use of the Gran Sasso radioactivity for tracker monitoring", OPERA note #47.
-
The "Vue-des-Alpes" underground laboratory on the web http://www.vda-lab.com.
-
NEMO 3 Proposal LAL 94-29 (1994).
-
Nuclear Instruments and Methods, A453 (2000) 255-258.
Footnotes:
1AMCRYS-H, 60, Lenin
ave, Kharkov, 310001, Ukraine.
2Bicron Corp., 12345 Kinsman Road, Newbury, Ohio
44065.
3Kuraray Co., Methacrylic Resin Division,
8F, Maruzen Building, 3-10, 2-Chrome, Hihonbashi, Chuo-ku, Tokyo,
103-0027, Japan.
4Pol.Hi.Tech. s.r.l.,
67061 CARSOLI (AQ), S.P. Turanense Km. 44.400, Italy.
5Nuclear Enterprise.
6Aériane S.A., rue des Poiriers, 7, B-5030
Gembloux, Belgium.
7SLOAN L5-UV5N
8MACtac Europe,
Boulevard Kennedy, B-7060 Soignies, Belgium
9Varitape, NV Frankrijkstraat, 5 9140 Temse,
Belgium
File translated from
TEX
by
TTH,
version 3.63.
On 25 Sep 2004, 18:47.
